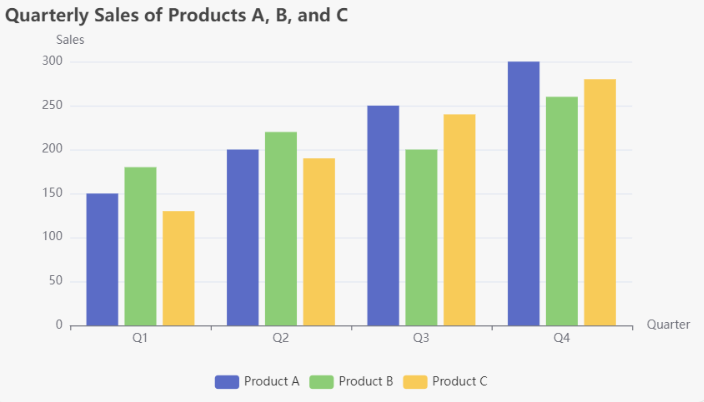
Tutorial: Creating Grouped Column Charts with Flexible Data Management
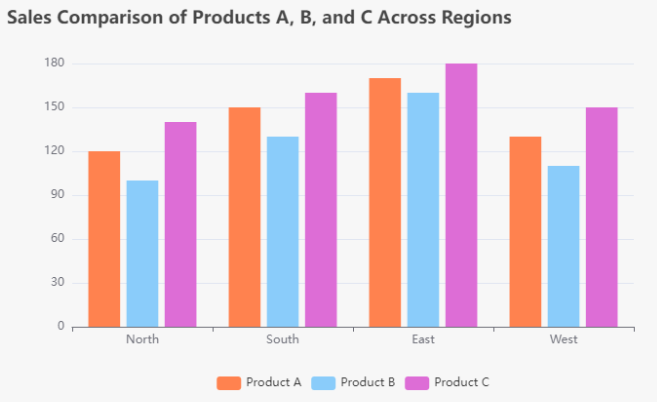
In this tutorial, we will explore how to create and customize grouped column charts using a fictional online chart-making tool, VP Online. Grouped column charts are excellent for comparing multiple variables across different categories, making them a favorite in …
Tutorial: Creating a Column Chart Using Visual Paradigm Online
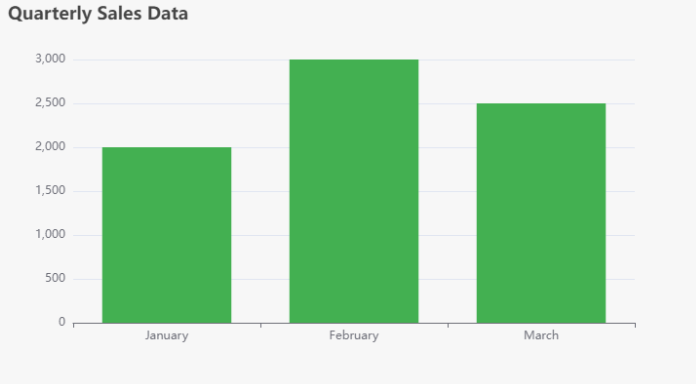
Column charts are a popular way to visualize data, representing values with vertical bars. They are especially useful for comparing different categories or groups. In this tutorial, we’ll explore how to create a column chart using Visual Paradigm Online, highlighting …
Visual Paradigm Online Chart Tool: Elevate Your Data Visualization
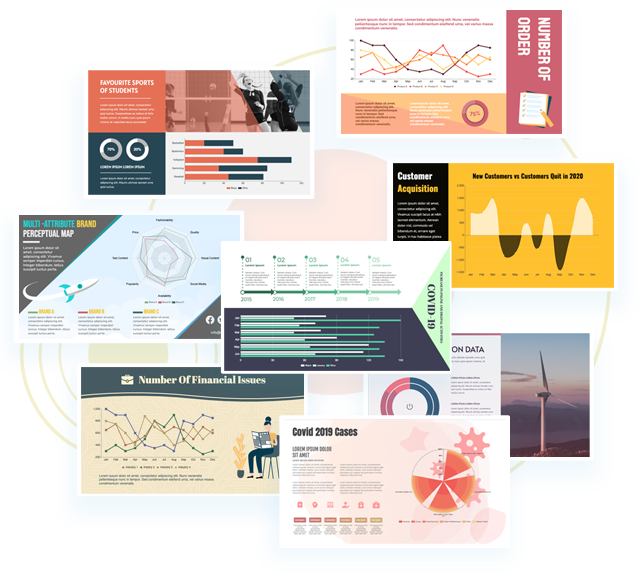
In today’s data-driven world, effectively communicating information is crucial. Whether for business reports, academic presentations, or marketing materials, the ability to visualize data clearly can make all the difference. Enter Visual Paradigm’s Online Chart Maker—an intuitive tool designed to …
Tutorial on Control Charts
What is a Control Chart?
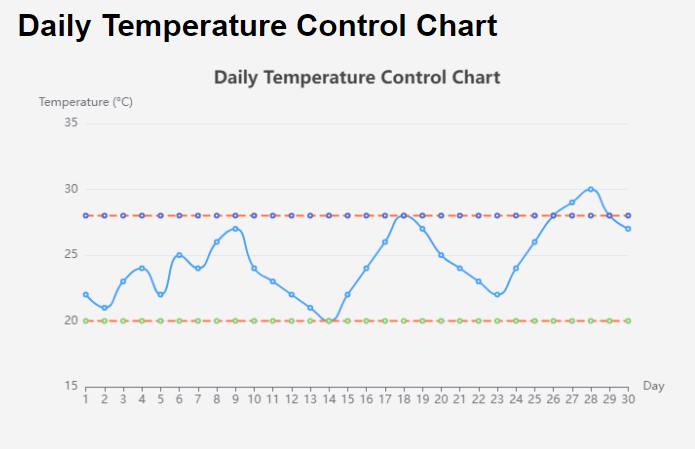
A Control Chart is a statistical tool used in quality management and statistical process control (SPC) to monitor and analyze process data over time. It helps identify variations in a process, detect trends or patterns, …
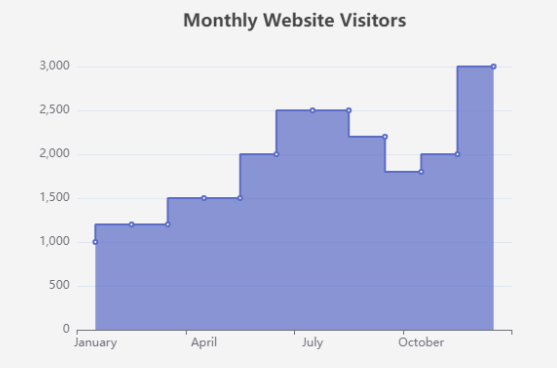
Comprehensive Guide to Step Charts
What is a Step Chart?
A step chart is a type of data visualization that displays data points in a way that emphasizes changes over time. Unlike line charts, where data points are connected with straight lines, step charts display …
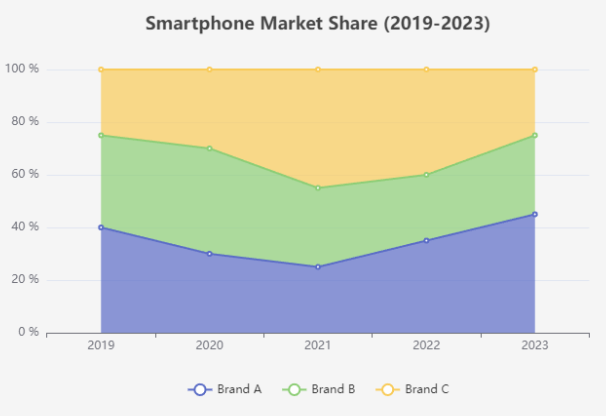
Tutorial: Creating 100% Stacked Line Charts with ECharts
Overview
A 100% Stacked Line Chart is a great way to visualize relative proportions of different categories over time. Unlike standard line charts, which show absolute values, a 100% stacked line chart displays the percentage contribution of each category, making …
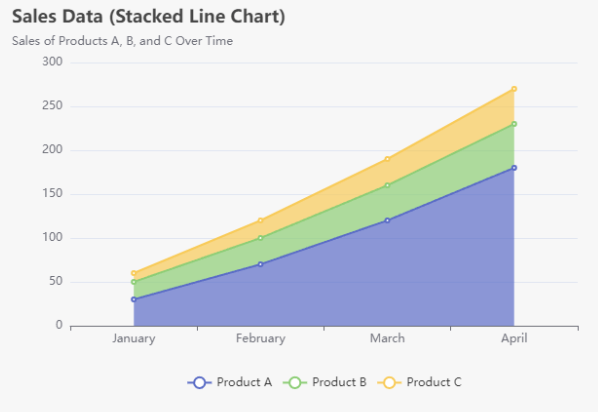
Tutorial: Stacked Line Charts
Introduction
Stacked line charts are a powerful way to visualize multiple data series over time or categories. Unlike standard line charts, where lines are plotted independently, stacked line charts stack the values of each series on top of one another, …
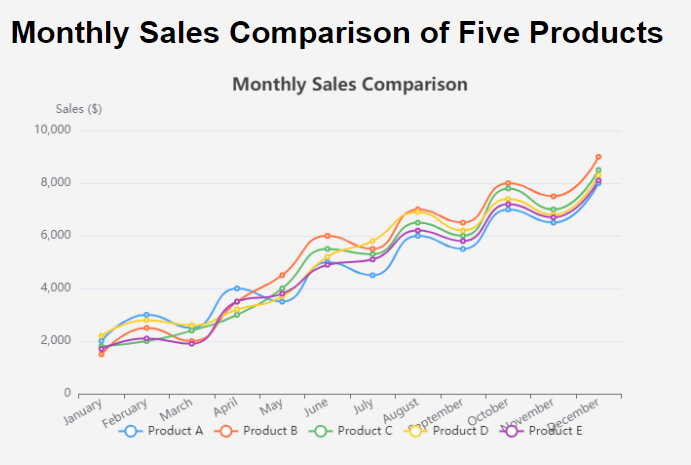
Tutorial on Curved Line Charts
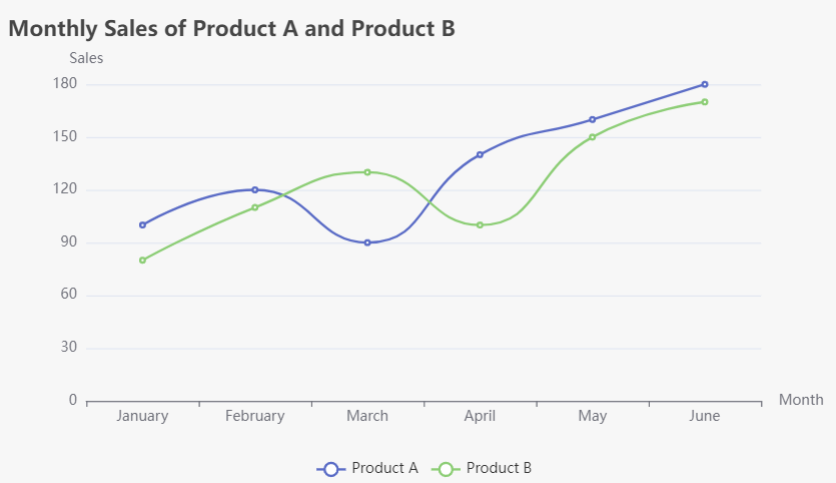
Curved line charts are a powerful way to visualize data that changes over time or across a continuous variable. Unlike traditional straight-line charts, curved line charts provide a smoother representation of trends, making it easier to identify patterns and fluctuations.…
Step-by-Step Guide to Creating a Bar Chart
Bar charts are a great way to compare quantities across different categories. In this guide, we will create a bar chart using Visual Paradigm Online Charting tool, visualize some realistic sales data, and interpret the results.
Step 1: Choose
…Tutorial on Line Charts
Line charts are a powerful way to visualize data trends over time. They consist of points connected by straight lines, making it easy to see changes in data at a glance. In this tutorial, we’ll explore key concepts related to …
