Understanding Butterfly Charts: A Comprehensive Guide
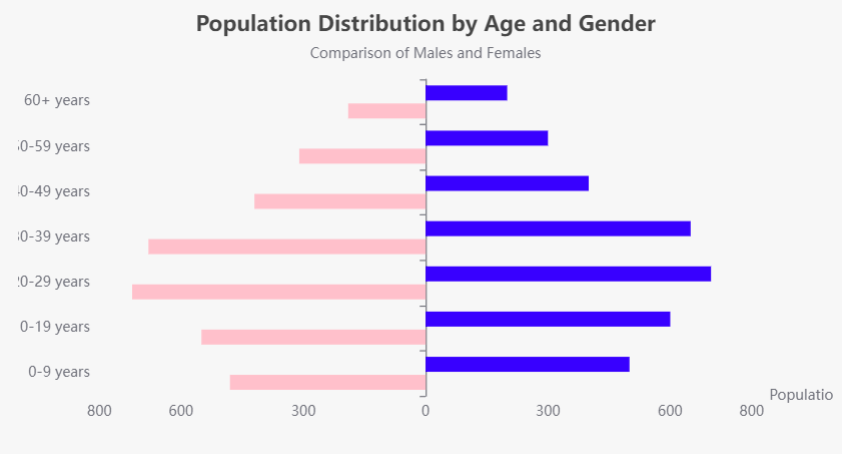
Butterfly charts, also known as back-to-back bar charts, are powerful tools for visually comparing two datasets side by side. They are particularly useful in fields such as demographic studies, market research, and survey analysis.
What is a Butterfly Chart?
…Understanding 100% Stacked Bar Charts
What is a 100% Stacked Bar Chart?
A 100% stacked bar chart is a variation of the traditional stacked bar chart in which each bar represents a total of 100%. This chart type is used to show the relative percentage …
Comprehensive Guide to Grouped Bar Charts
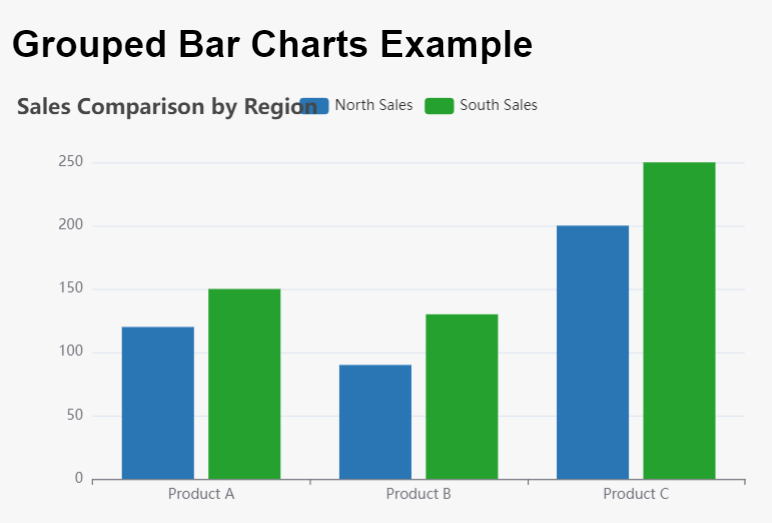
Grouped bar charts are a powerful visualization tool used to display and compare the values of multiple categories across different groups. They allow for easy comparison of data points, making them particularly useful in various fields such as business, education, …
Case Study: Stacked Bar Chart Using Visual Paradigm Online
Introduction
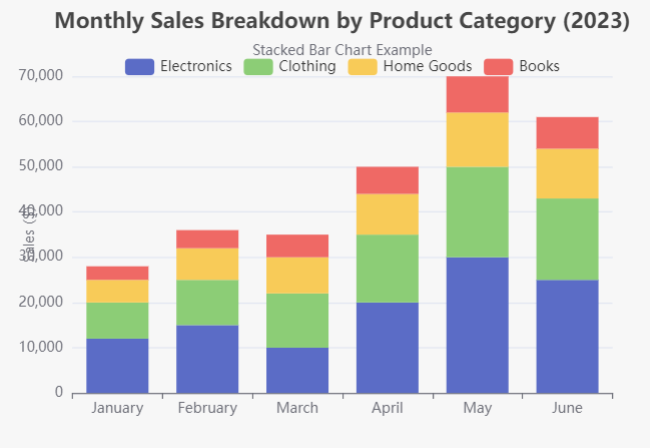
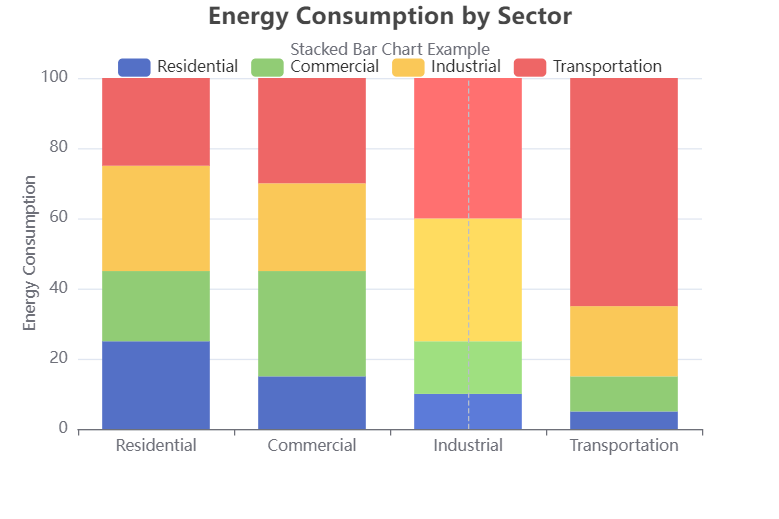
Stacked bar charts are an effective way to visualize categorical data by displaying multiple data series stacked on top of one another. This format allows for easy comparison of total values across categories, as well as an understanding of …
Mastering Stacked Bar Charts: A Versatile Data Visualization Technique
In the ever-evolving world of data visualization, stacked bar charts have emerged as a powerful tool for effectively communicating complex information. Unlike their standard bar chart counterparts, stacked bar charts offer a unique way to represent multiple data series within …
Crafting Compelling Timelines with Mind Maps: A Powerful Approach
What is a Mind map
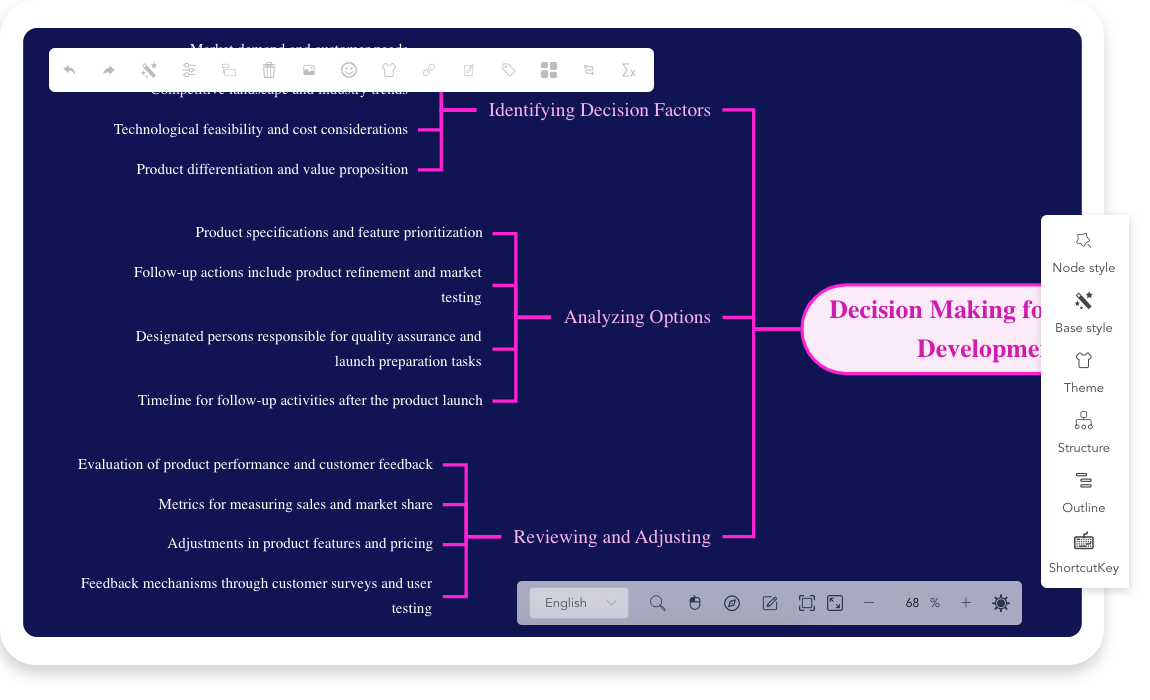
A mindmap is a visual thinking and learning tool that allows you to organize information in a radial, non-linear manner. It typically starts with a central concept or theme, from which related ideas, facts, and …
Step-by-Step Guide to Strategic Analysis with PESTLE & Porter’s Five Forces
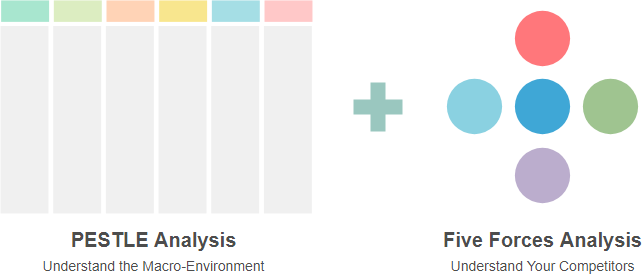
Strategic analysis is essential for understanding the external environment in which an organization operates. Here’s a structured guide to conducting a PESTLE and Porter’s Five Forces analysis.
What is PESTLE?
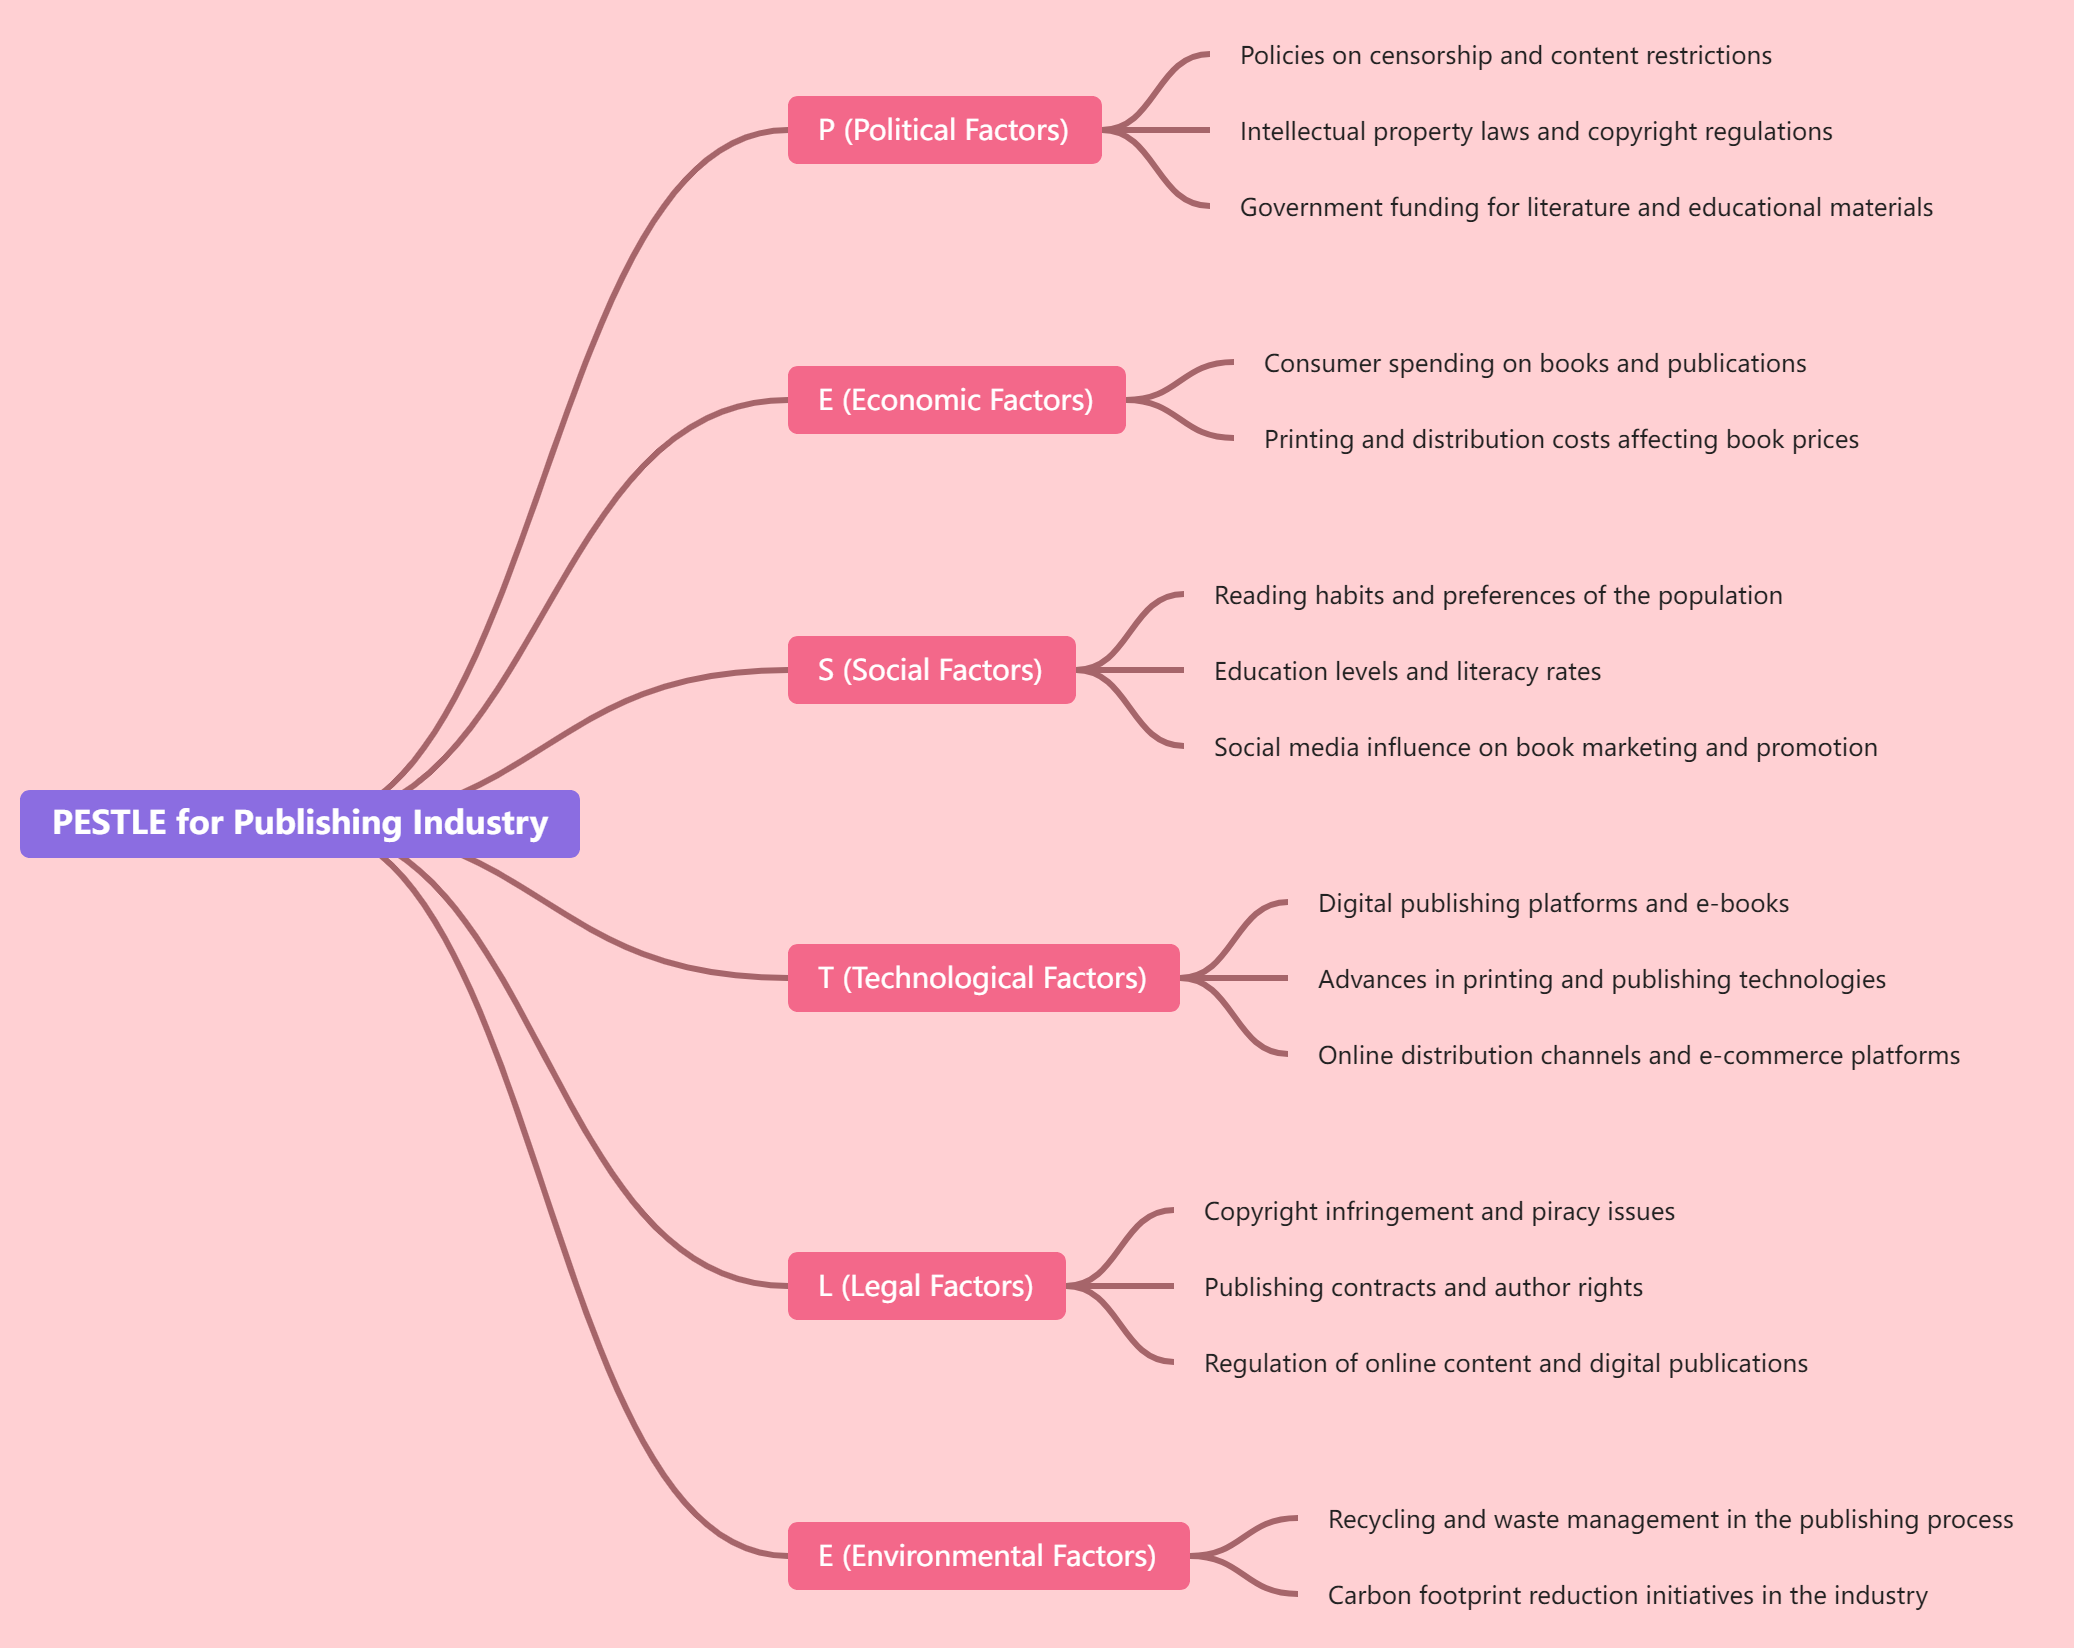
PESTLE (or PESTEL) is a strategic framework used to analyze …
Step-by-Step Guide to Creating Infographics with Visual Paradigm Online
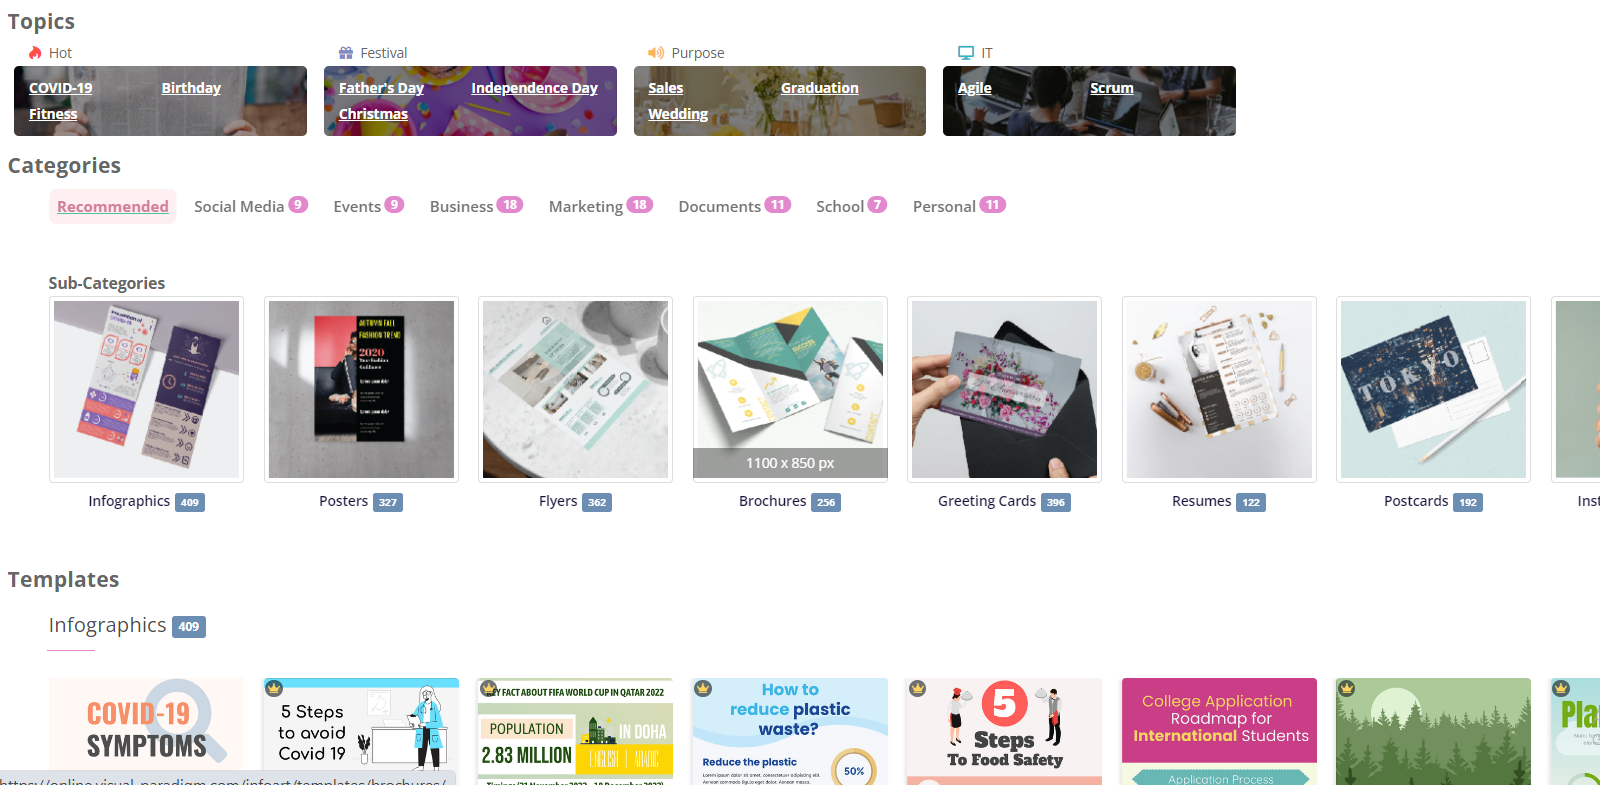
Infographics are a powerful way to present information visually, making complex data easy to understand and engaging for your audience. With Visual Paradigm Online, creating stunning infographics is a breeze. Follow this comprehensive step-by-step guide to design your own …
