Category: AI Powered Chart Generator
The Comprehensive Guide to Bar Charts: Visualizing Data for Clear Comparisons
Introduction
In the world of data visualization, bar charts stand out as one of the most effective tools for comparing discrete data across different categories. Their simplicity and clarity make them a popular choice for presenting information in a way …
Creating Multi-Series Charts with Visual Paradigm

Introduction
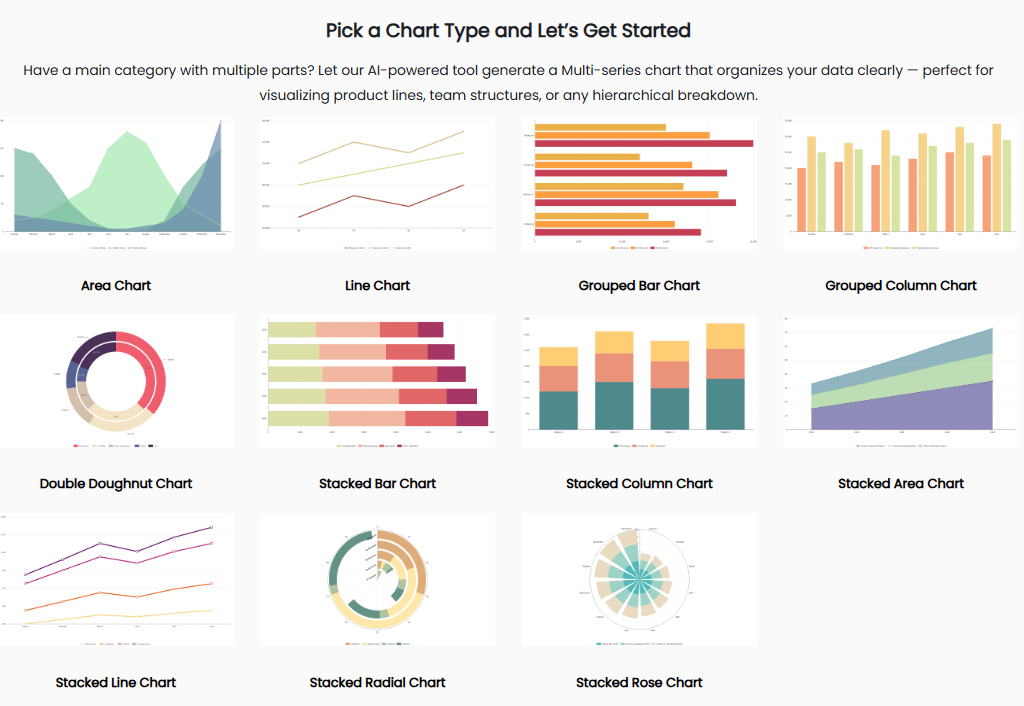
Multi-series charts are a powerful way to visualize multiple datasets on a single graph, enabling easy comparison of trends or metrics. For example, you might use a multi-series line chart to compare sales performance across different products over time. …
Comprehensive Guide to Using Visual Paradigm’s AI Column Chart Generator
Introduction
Visual Paradigm’s AI Column Chart Generator is a powerful tool designed to simplify the creation of professional and visually appealing column charts. By integrating artificial intelligence, it likely automates parts of the chart creation process, such as suggesting optimal …