Category: Chart
Case Study: Stacked Bar Chart Using Visual Paradigm Online

Introduction
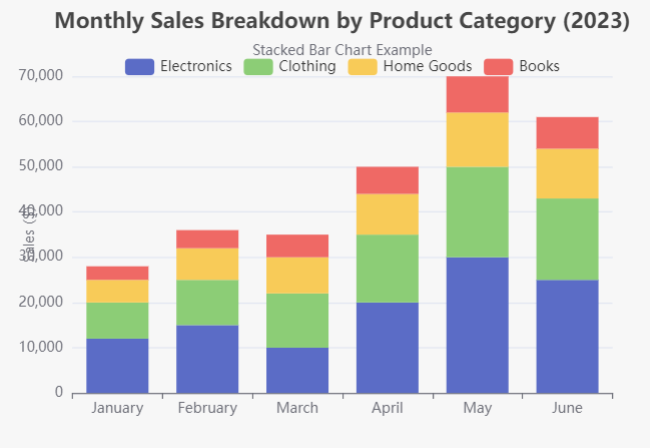
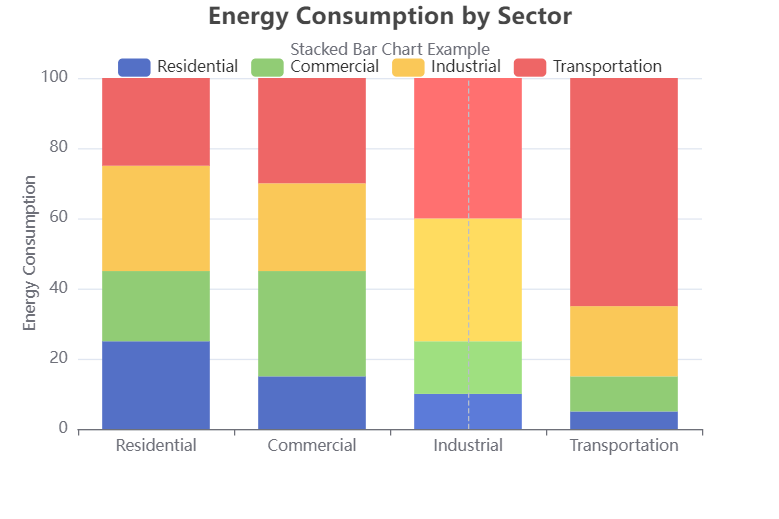
Stacked bar charts are an effective way to visualize categorical data by displaying multiple data series stacked on top of one another. This format allows for easy comparison of total values across categories, as well as an understanding of …
Mastering Stacked Bar Charts: A Versatile Data Visualization Technique

In the ever-evolving world of data visualization, stacked bar charts have emerged as a powerful tool for effectively communicating complex information. Unlike their standard bar chart counterparts, stacked bar charts offer a unique way to represent multiple data series within …