Introduction
In today’s data-driven world, visualizing data effectively is crucial for making informed decisions. Whether you’re creating business reports, analyzing marketing trends, or presenting academic research, choosing the right chart type can significantly enhance your data presentation. This guide will help you understand different chart types and how to use AI-powered chart generators to create stunning visuals effortlessly.
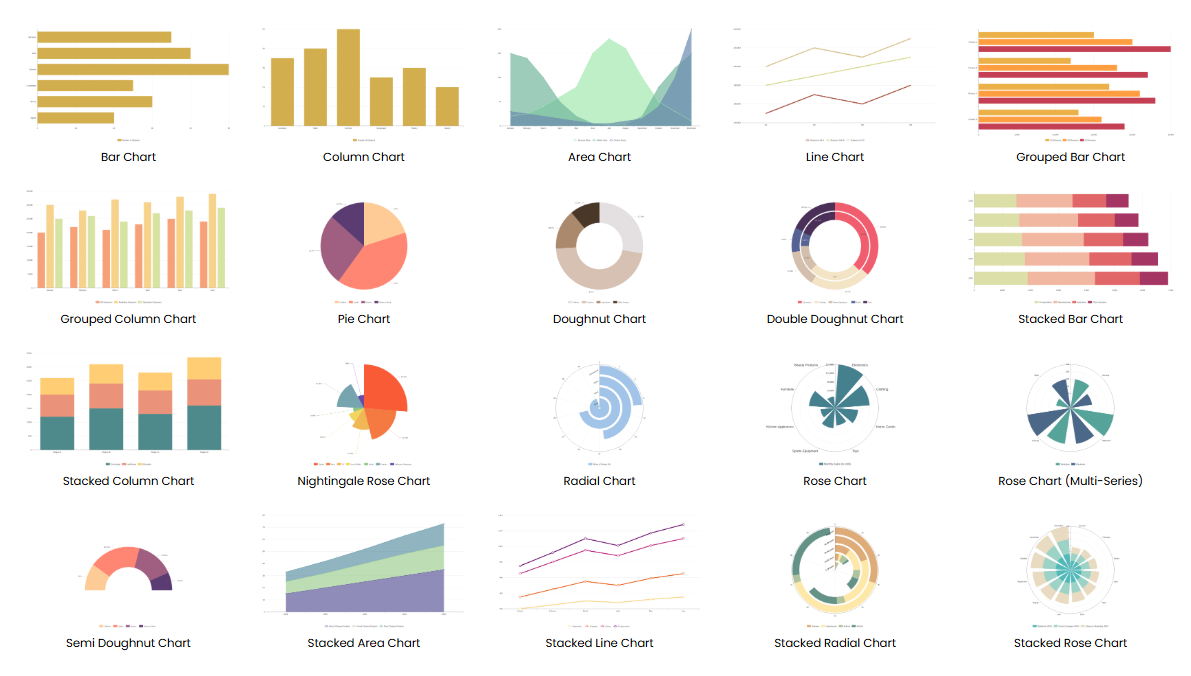
Understanding Chart Types
Multi-series Charts
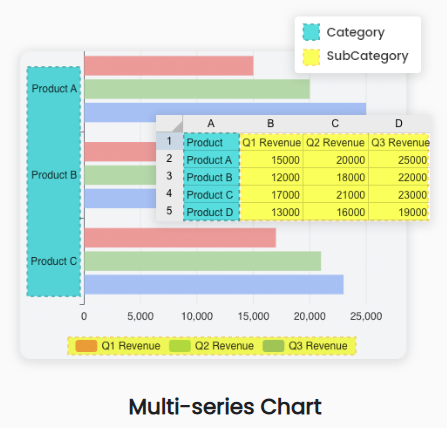
Use Case: Comparing multiple groups across multiple variables.
Examples: Line charts, bar charts, and area charts.
When to Use: When you need to show trends over time for multiple categories or compare multiple data series.
Single-series Charts
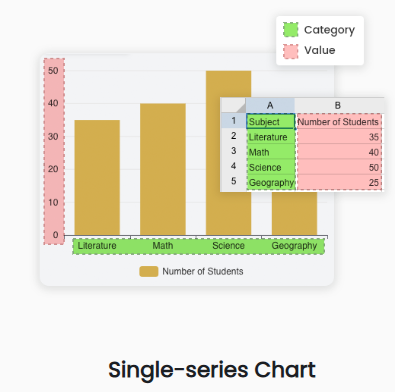
Use Case: Tracking one variable over time or comparing single values across categories.
Examples: Pie charts, single-line charts, and single-bar charts.
When to Use: When you need to focus on a single data series or compare individual values.
Double Doughnut Charts
Use Case: Displaying hierarchical data or parts of a whole with multiple layers.
Examples: Doughnut charts with multiple rings.
When to Use: When you need to show relationships between different data sets within a single chart.
Introducing Visual Paradigm Online’s AI Chart Generator
What is the AI Chart Generator?
Visual Paradigm Online‘s AI Chart Generator is an advanced tool that helps you create professional charts quickly and easily. By describing your data, the AI-powered generator will suggest the best chart type for your needs.

Features and Benefits
- Instant AI-Generated Charts: Enter your data, and the AI generates the perfect chart for you.
- Multiple Chart Types: Supports bar, line, pie, scatter, and more.
- Customizable Designs: Modify colors, labels, and formats to match your style.
- Data-Driven Insights: Visualize trends and make informed decisions effortlessly.
- Easy Export & Sharing: Download charts or share them online with your team.
Use Cases
Business Reports & Analytics
Generate clear, data-driven visuals for financial reports and performance tracking.
Marketing & Sales Insights
Analyze trends, customer behavior, and campaign performance effortlessly.
Project Management & KPI Tracking
Monitor progress with real-time, AI-generated visual charts.
Academic Research & Data Presentation
Turn raw data into compelling charts for research papers and presentations.
Website & Dashboard Visuals
Easily create interactive charts to display live data on websites or dashboards.
Surveys & Poll Results
Visualize survey responses and poll data in an easy-to-understand format.
Step-by-Step Guide to Using the AI Chart Generator
Step 1: Describe Your Data
Start by describing the data you want to visualize. The more detailed your description, the better the AI can suggest the appropriate chart type.
Step 2: Select the Chart Type
Based on your description, the AI will suggest the best chart type for your data. You can choose from a variety of chart types, including bar, line, pie, scatter, and more.
Step 3: Customize Your Chart
Once the chart is generated, you can customize it to match your style and needs. Modify colors, labels, and formats to create a visually appealing chart.
Step 4: Export and Share
After customizing your chart, you can download it or share it online with your team. This makes it easy to collaborate and make data-driven decisions.
Frequently Asked Questions
What is an AI chart generator?
An AI chart generator automatically creates visual charts based on your data, saving time and effort in data visualization.
Can I customize my charts?
Yes! You can edit colors, labels, formats, and chart types to match your style and needs.
Is this tool useful for teams?
Absolutely! Easily share charts with your team for collaboration and decision-making.
What are the benefits of AI-powered chart generation?
AI automates the process, ensuring accurate, visually appealing charts in seconds—no manual effort required.
Is any design experience or skill required to use this tool?
No, the AI Chart Generator is designed to be user-friendly and requires no prior design experience.
Conclusion
Choosing the right chart type and utilizing AI-powered tools like Visual Paradigm Online’s AI Chart Generator can significantly enhance your data visualization efforts. Whether you’re a business professional, marketer, researcher, or project manager, this guide provides the knowledge and tools you need to create stunning, insightful charts effortlessly.