
Introduction
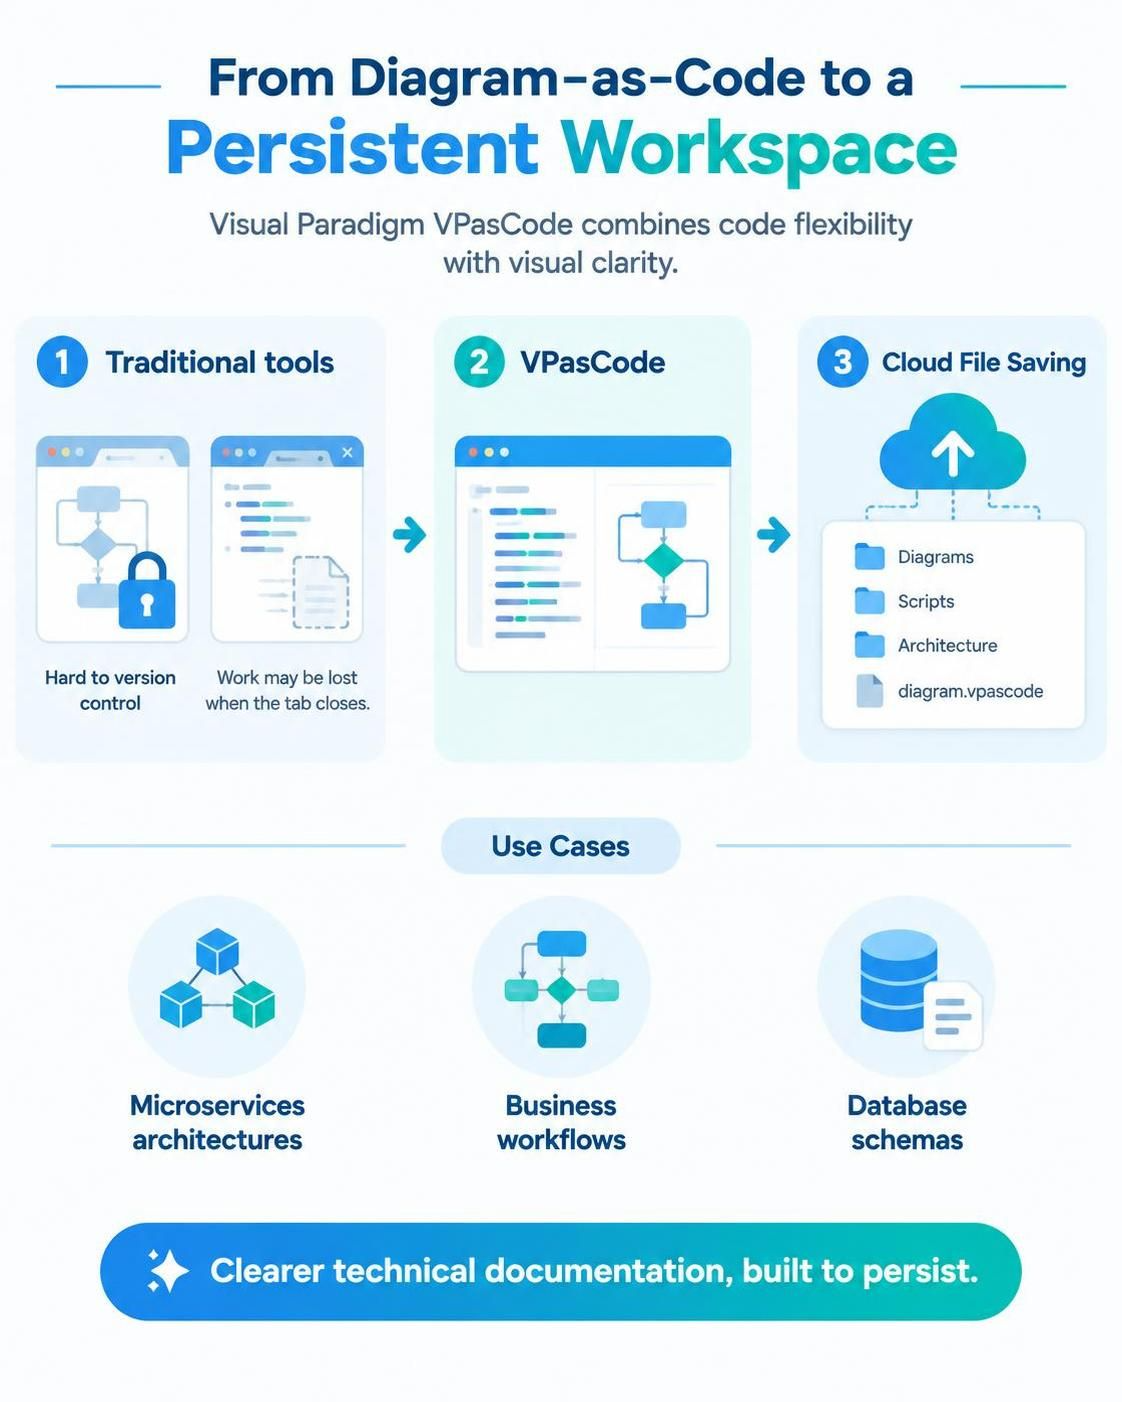
In the modern software development lifecycle, visual documentation is no longer a luxury—it is a necessity. Whether you are mapping out complex microservices architectures, documenting business workflows, or designing database schemas, diagrams provide clarity that text alone often cannot achieve. However, traditional diagramming tools often suffer from two major drawbacks: they are either rigid graphical editors that are difficult to version control, or they are transient code-based editors where work is lost once the browser tab is closed.
Enter Visual Paradigm VPasCode, a browser-based environment that bridges the gap between code flexibility and visual clarity. With its latest enhancement—Cloud File Saving—VPasCode has evolved from a simple editor into a persistent workspace. This guide explores how this new feature transforms the diagram-as-code workflow, allowing developers, architects, and analysts to save, organize, and manage their diagram scripts directly in the cloud.
Key Concepts
Before diving into the tooling, it is essential to understand the core concepts that make VPasCode a powerful solution for technical documentation.
1. Diagram-as-Code (DaC)
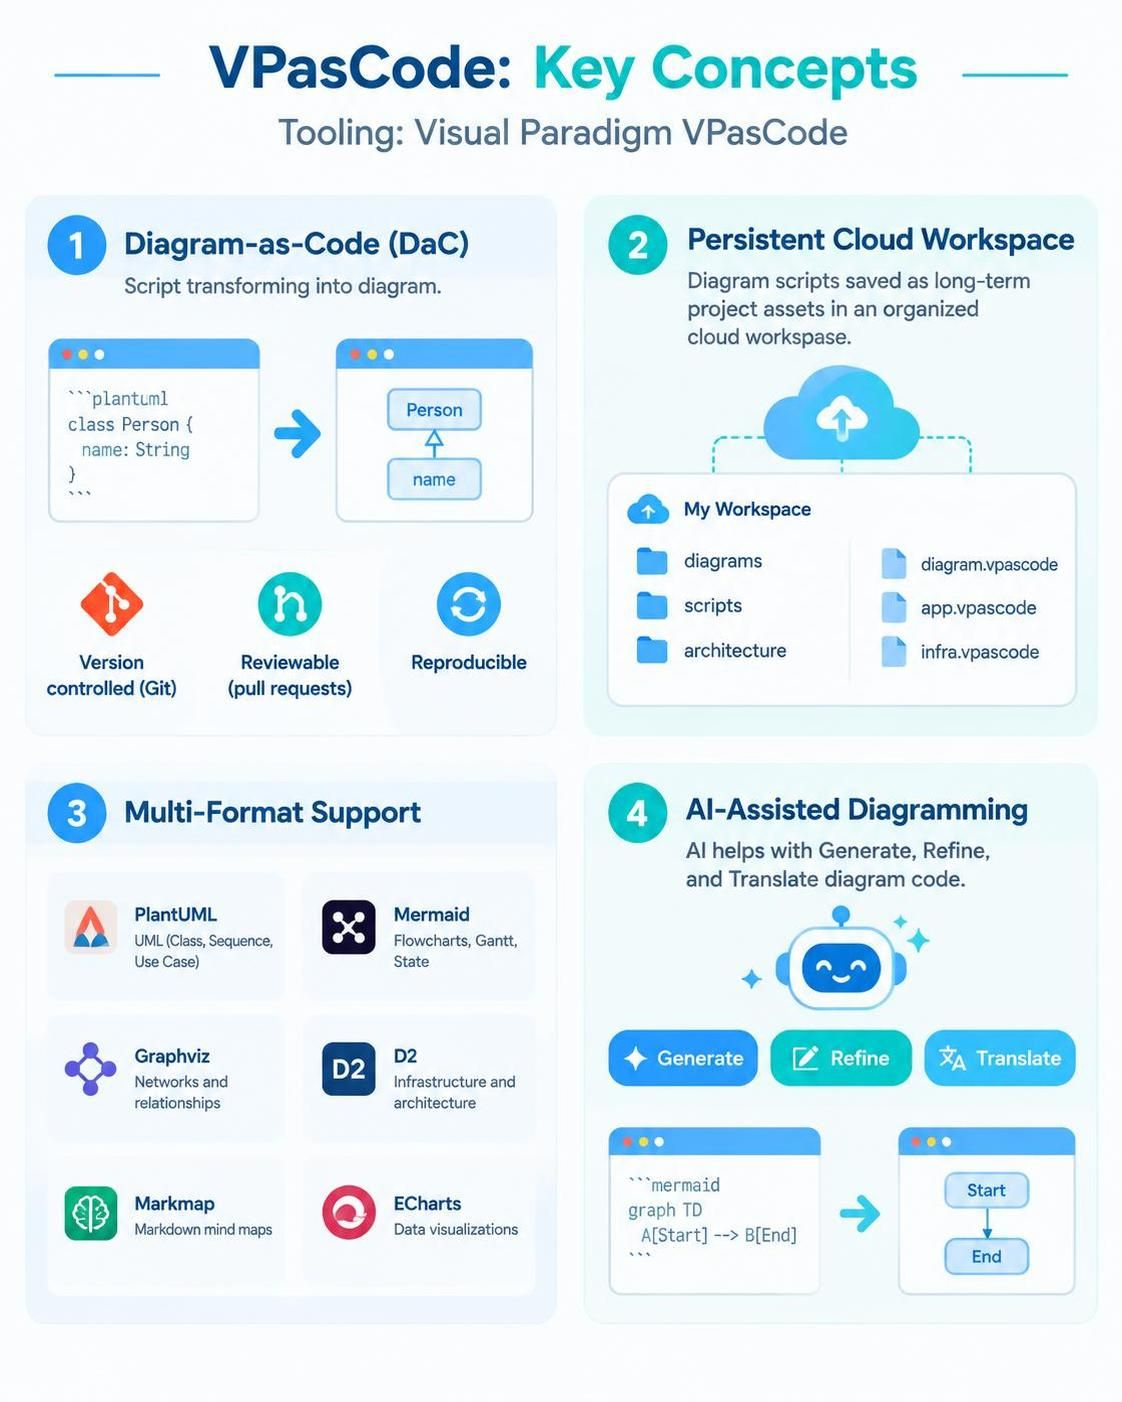
Diagram-as-Code is an approach where diagrams are defined using textual scripts rather than drag-and-drop interfaces. This allows diagrams to be:
-
Version Controlled: Stored in Git alongside source code.
-
Reviewable: Changes can be reviewed via pull requests.
-
Reproducible: The same script always generates the same visual output.
2. Persistent Cloud Workspace
Unlike temporary online editors, VPasCode’s new cloud integration allows users to save their work directly to their Visual Paradigm cloud workspace. This ensures that diagrams are treated as long-term project assets rather than disposable snippets.
3. Multi-Format Support
VPasCode is not limited to a single syntax. It supports a wide array of industry-standard formats, including:
-
PlantUML: For UML diagrams (Class, Sequence, Use Case, etc.).
-
Mermaid: For flowcharts, Gantt charts, and state diagrams.
-
Graphviz: For network topologies and relationship graphs.
-
D2: For declarative infrastructure and architecture diagrams.
-
Markmap: For interactive mind maps from Markdown.
-
ECharts: For data-driven visualizations.
4. AI-Assisted Diagramming
VPasCode integrates AI capabilities to generate, refine, and translate diagram code. This reduces the learning curve for new syntaxes and accelerates the iteration process.
Tooling: Visual Paradigm VPasCode
VPasCode is designed to be a comprehensive workspace for text-based visualization. Below is a detailed look at how the new cloud file-saving feature enhances the user experience.
Why Cloud File Saving Matters
In traditional online diagram editors, managing multiple diagrams is cumbersome. Users often resort to:
-
Keeping multiple browser tabs open, leading to confusion and accidental closures.
-
Manually copying code to local files, breaking the seamless online workflow.
-
Losing context when switching between different projects or systems.
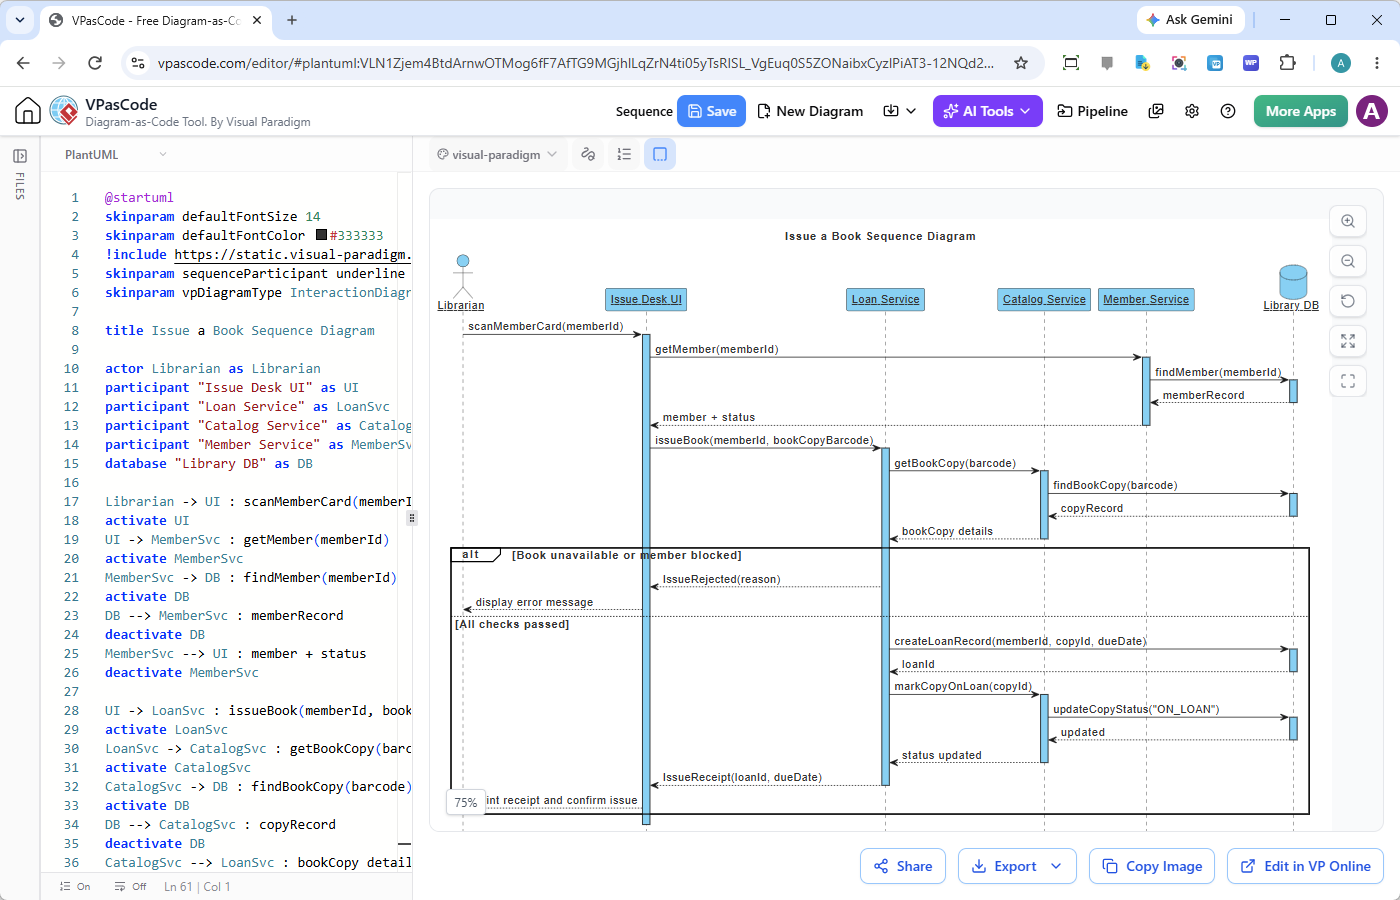
VPasCode addresses these pain points by introducing a Project Files Pane. This pane acts as a central hub for all your diagram scripts, organized by project.
Core Features of the New Update
-
Create Diagram Files: Start new diagrams directly from the Project Files pane.
-
Save to Cloud: Persist your work in your Visual Paradigm cloud workspace.
-
Reopen Saved Diagrams: Access previous work instantly without searching through history.
-
Organize by Project: Group diagrams by system, team, or initiative.
-
Move Files Between Projects: Reorganize assets as your project structure evolves.
-
Sort Options: Find files quickly by name, date, or type.
How to Use Cloud File Saving in VPasCode
Getting started with the new cloud features is straightforward. Follow these steps to integrate VPasCode into your daily workflow.
Step 1: Sign In
Open VPasCode and log in to your Visual Paradigm account. Authentication is required to access your personal cloud workspace.
Step 2: Access the Project Files Pane
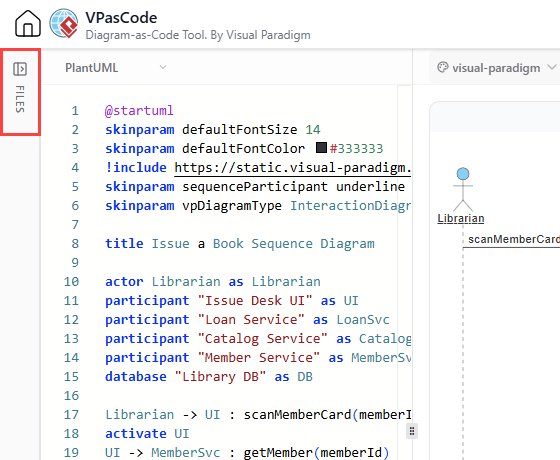
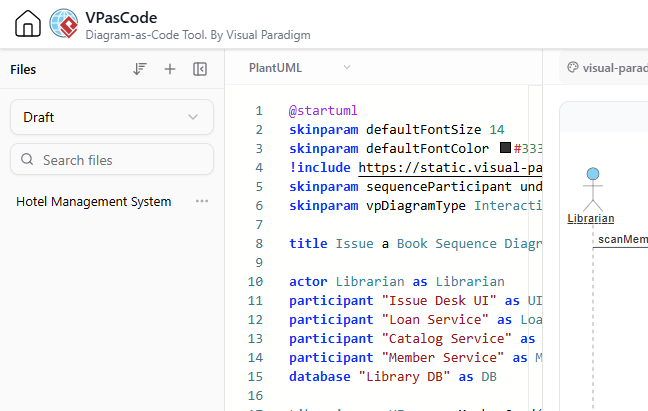
Click the Files sidebar on the left to expand the Project Files pane. This is where all your saved diagrams will reside.
Step 3: Create and Edit
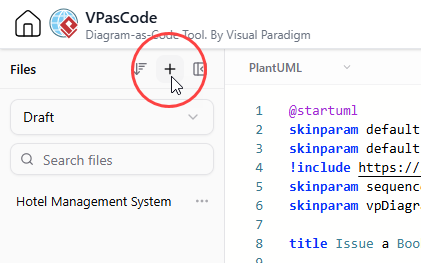
You can create a new diagram by clicking the + button in the Files pane or selecting New Diagram from the app bar. Write your code in any supported format (e.g., PlantUML, Mermaid).

Step 4: Save to Cloud
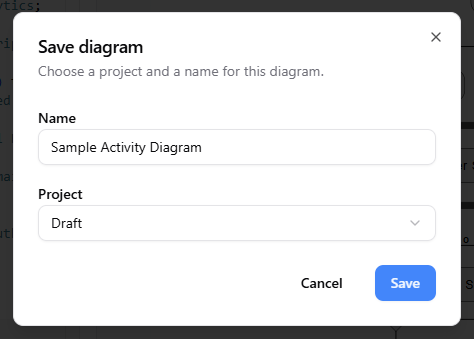
Click the Save button in the app bar. If it’s your first time saving, you will be prompted to select a Visual Paradigm project.

Step 5: Reopen and Organize
To return to a diagram, simply click its name in the Project Files pane. You can also move files between projects or sort them using the options at the top of the pane.
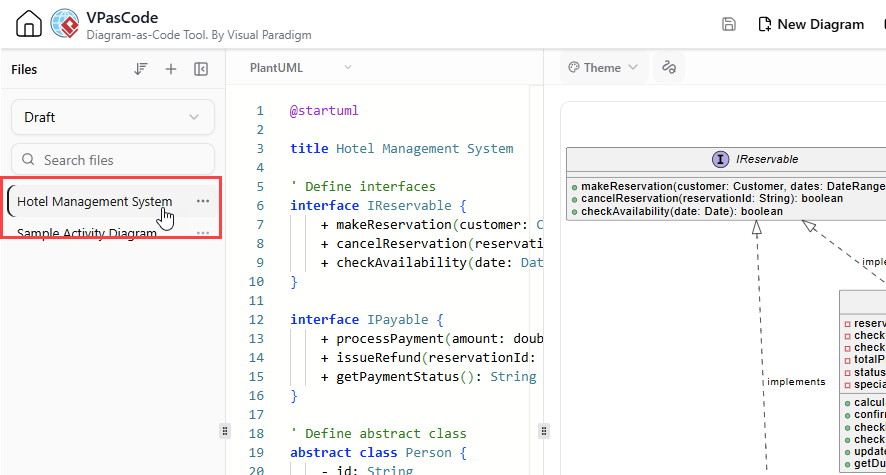
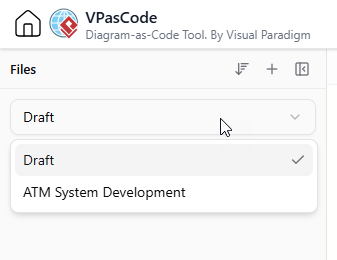
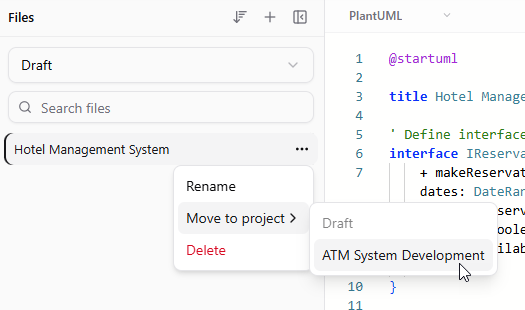
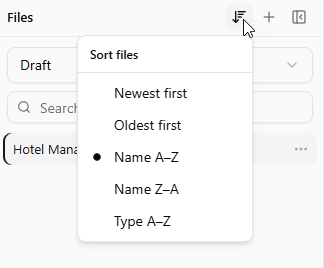
Diagram Examples using PlantUML
One of the most popular use cases for VPasCode is creating UML diagrams with PlantUML. Below are examples of how you can leverage VPasCode to create complex visualizations.
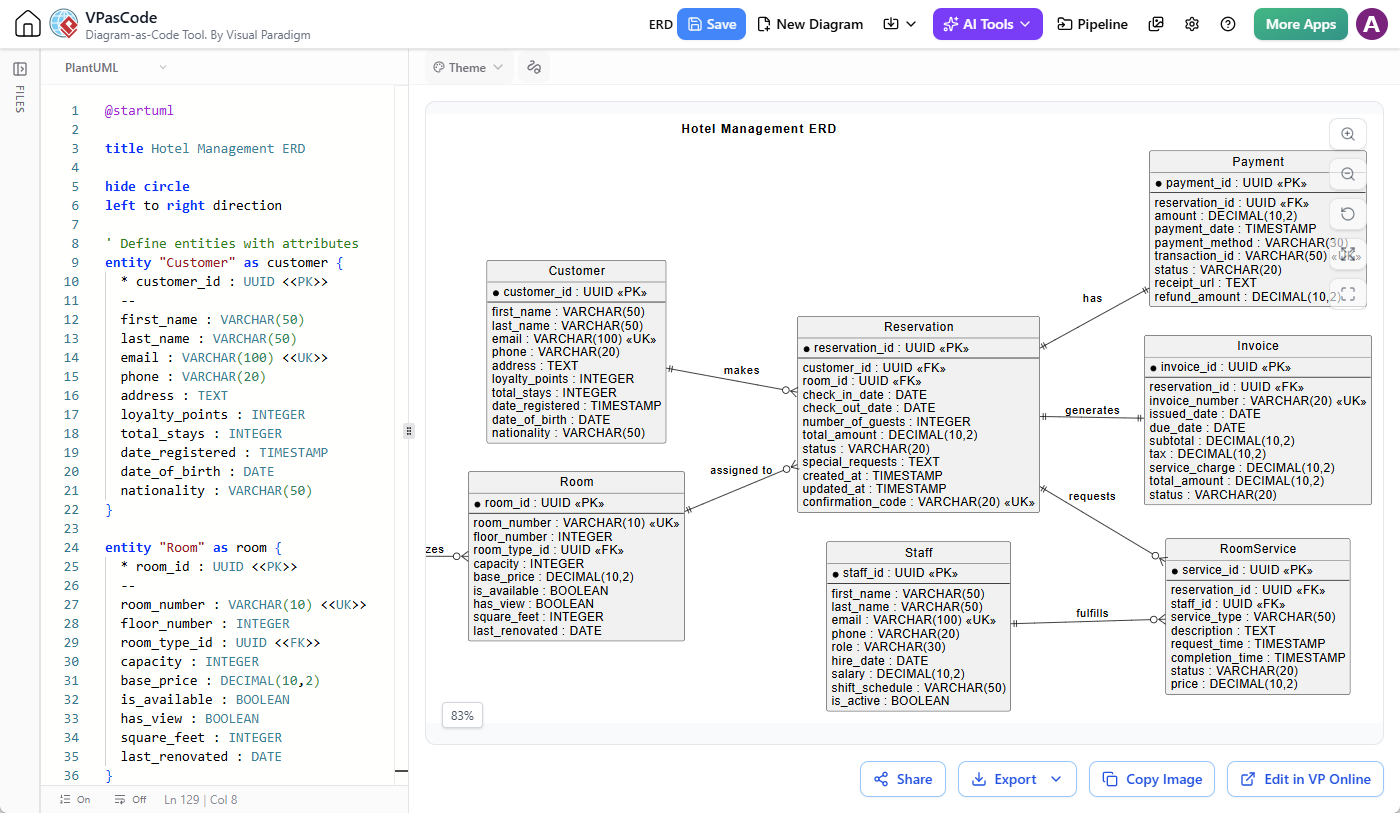
Example 1: Hotel Management Entity Relationship Diagram (ERD)
This example demonstrates how to model a hotel management system, including customers, rooms, reservations, and staff.
@startuml

title Hotel Management ERD

hide circle
left to right direction

' Define entities with attributes
entity "Customer" as customer {
  * customer_id : UUID <<PK>>
  --
  first_name : VARCHAR(50)
  last_name : VARCHAR(50)
  email : VARCHAR(100) <<UK>>
  phone : VARCHAR(20)
  address : TEXT
  loyalty_points : INTEGER
  total_stays : INTEGER
  date_registered : TIMESTAMP
  date_of_birth : DATE
  nationality : VARCHAR(50)
}

entity "Room" as room {
  * room_id : UUID <<PK>>
  --
  room_number : VARCHAR(10) <<UK>>
  floor_number : INTEGER
  room_type_id : UUID <<FK>>
  capacity : INTEGER
  base_price : DECIMAL(10,2)
  is_available : BOOLEAN
  has_view : BOOLEAN
  square_feet : INTEGER
  last_renovated : DATE
}

entity "RoomType" as roomtype {
  * room_type_id : UUID <<PK>>
  --
  type_name : VARCHAR(50) <<UK>>
  description : TEXT
  standard_capacity : INTEGER
  base_price : DECIMAL(10,2)
  extra_bed_charge : DECIMAL(10,2)
  has_kitchenette : BOOLEAN
  has_balcony : BOOLEAN
}

entity "Reservation" as reservation {
  * reservation_id : UUID <<PK>>
  --
  customer_id : UUID <<FK>>
  room_id : UUID <<FK>>
  check_in_date : DATE
  check_out_date : DATE
  number_of_guests : INTEGER
  total_amount : DECIMAL(10,2)
  status : VARCHAR(20)
  special_requests : TEXT
  created_at : TIMESTAMP
  updated_at : TIMESTAMP
  confirmation_code : VARCHAR(20) <<UK>>
}

entity "Payment" as payment {
  * payment_id : UUID <<PK>>
  --
  reservation_id : UUID <<FK>>
  amount : DECIMAL(10,2)
  payment_date : TIMESTAMP
  payment_method : VARCHAR(30)
  transaction_id : VARCHAR(50) <<UK>>
  status : VARCHAR(20)
  receipt_url : TEXT
  refund_amount : DECIMAL(10,2)
}

entity "Invoice" as invoice {
  * invoice_id : UUID <<PK>>
  --
  reservation_id : UUID <<FK>>
  invoice_number : VARCHAR(20) <<UK>>
  issued_date : DATE
  due_date : DATE
  subtotal : DECIMAL(10,2)
  tax : DECIMAL(10,2)
  service_charge : DECIMAL(10,2)
  total_amount : DECIMAL(10,2)
  status : VARCHAR(20)
}

entity "Staff" as staff {
  * staff_id : UUID <<PK>>
  --
  first_name : VARCHAR(50)
  last_name : VARCHAR(50)
  email : VARCHAR(100) <<UK>>
  phone : VARCHAR(20)
  role : VARCHAR(30)
  hire_date : DATE
  salary : DECIMAL(10,2)
  shift_schedule : VARCHAR(50)
  is_active : BOOLEAN
}

entity "RoomService" as roomservice {
  * service_id : UUID <<PK>>
  --
  reservation_id : UUID <<FK>>
  staff_id : UUID <<FK>>
  service_type : VARCHAR(50)
  description : TEXT
  request_time : TIMESTAMP
  completion_time : TIMESTAMP
  status : VARCHAR(20)
  price : DECIMAL(10,2)
}

' Relationships
customer ||--o{ reservation : "makes"
room ||--o{ reservation : "assigned to"
reservation ||--|| payment : "has"
reservation ||--|| invoice : "generates"
reservation ||--o{ roomservice : "requests"
staff ||--o{ roomservice : "fulfills"
roomtype ||--o{ room : "categorizes"

@enduml
Example 2: Insurance Claim Process Flowchart (Mermaid)
While PlantUML is great for UML, Mermaid is excellent for flowcharts. Here is an example of an insurance claim process.
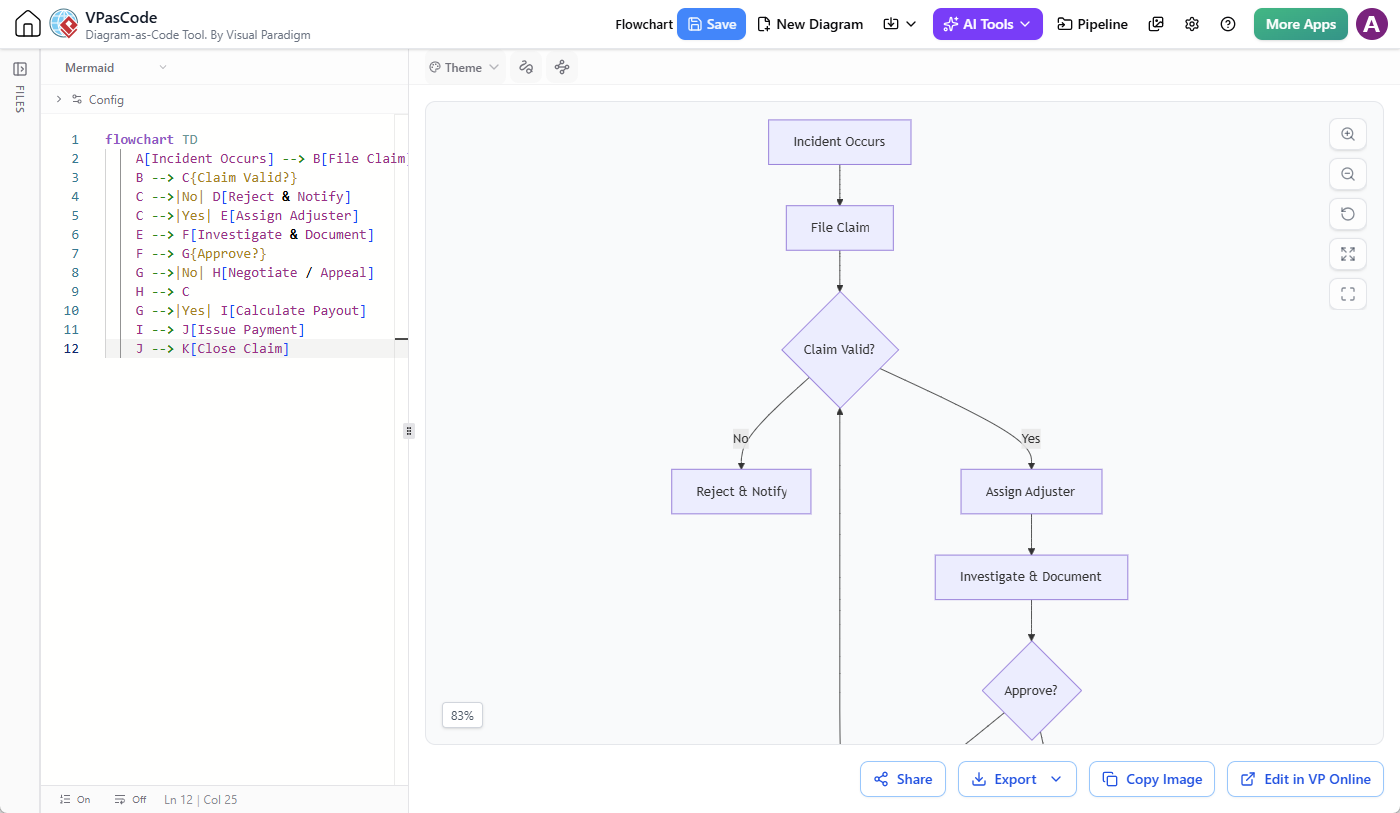
flowchart TD
    A[Incident Occurs] --> B[File Claim]
    B --> C{Claim Valid?}
    C -->|No| D[Reject & Notify]
    C -->|Yes| E[Assign Adjuster]
    E --> F[Investigate & Document]
    F --> G{Approve?}
    G -->|No| H[Negotiate / Appeal]
    H --> C
    G -->|Yes| I[Calculate Payout]
    I --> J[Issue Payment]
    J --> K[Close Claim]
Example 3: Data Center Network Topology (Graphviz)
For network engineers, Graphviz provides powerful tools for visualizing infrastructure.
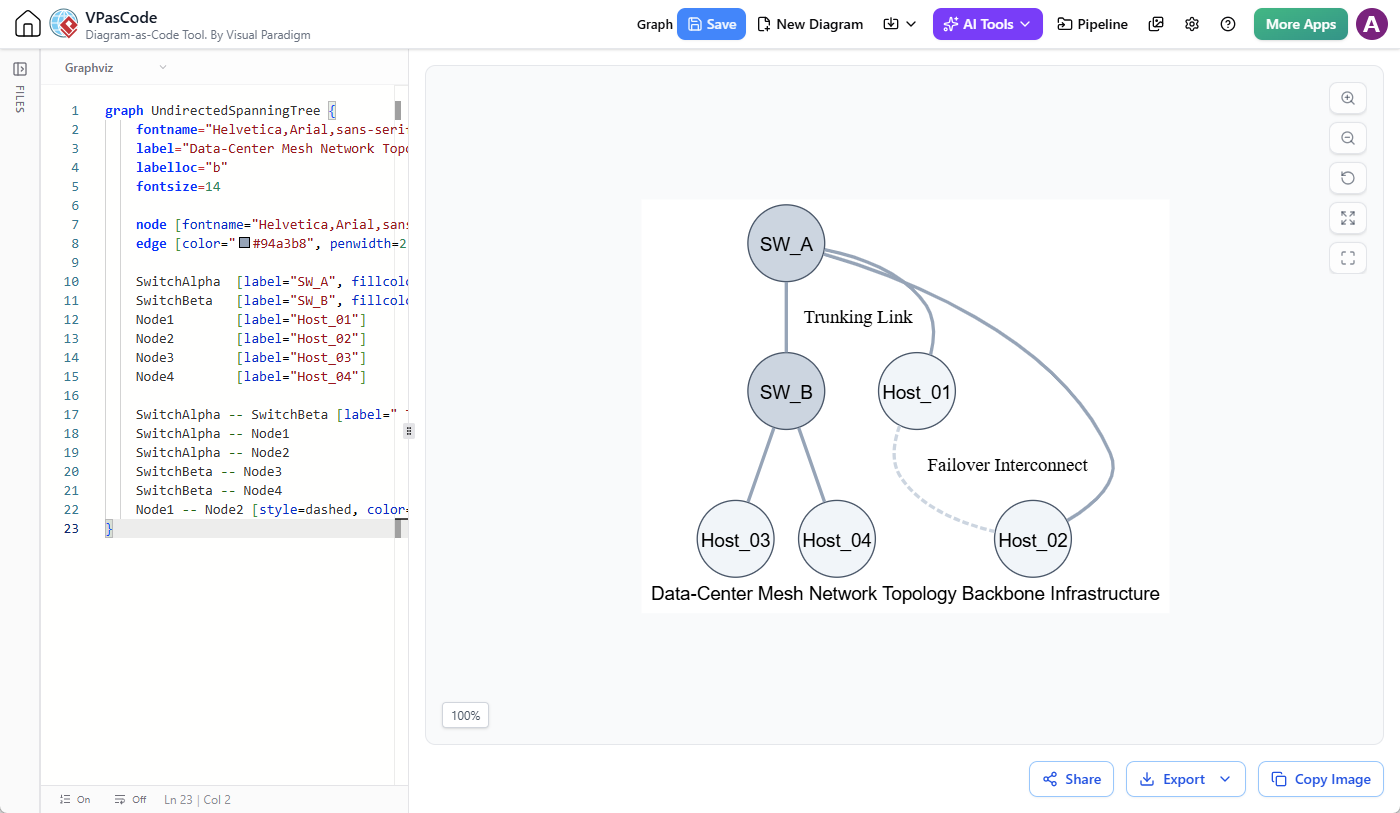
graph UndirectedSpanningTree {
    fontname="Helvetica,Arial,sans-serif"
    label="Data-Center Mesh Network Topology Backbone Infrastructure"
    labelloc="b"
    fontsize=14

    node [fontname="Helvetica,Arial,sans-serif", shape=circle, style=filled, color="#475569", fillcolor="#f1f5f9", width=0.8, fixedsize=true]
    edge [color="#94a3b8", penwidth=2.5]

    SwitchAlpha  [label="SW_A", fillcolor="#cbd5e1"]
    SwitchBeta   [label="SW_B", fillcolor="#cbd5e1"]
    Node1        [label="Host_01"]
    Node2        [label="Host_02"]
    Node3        [label="Host_03"]
    Node4        [label="Host_04"]

    SwitchAlpha -- SwitchBeta [label=" Trunking Link", weight=5]
    SwitchAlpha -- Node1
    SwitchAlpha -- Node2
    SwitchBeta -- Node3
    SwitchBeta -- Node4
    Node1 -- Node2 [style=dashed, color="#cbd5e1", label=" Failover Interconnect"]
}
Example 4: Microservices Architecture (D2)
D2 is ideal for describing modern cloud-native architectures.
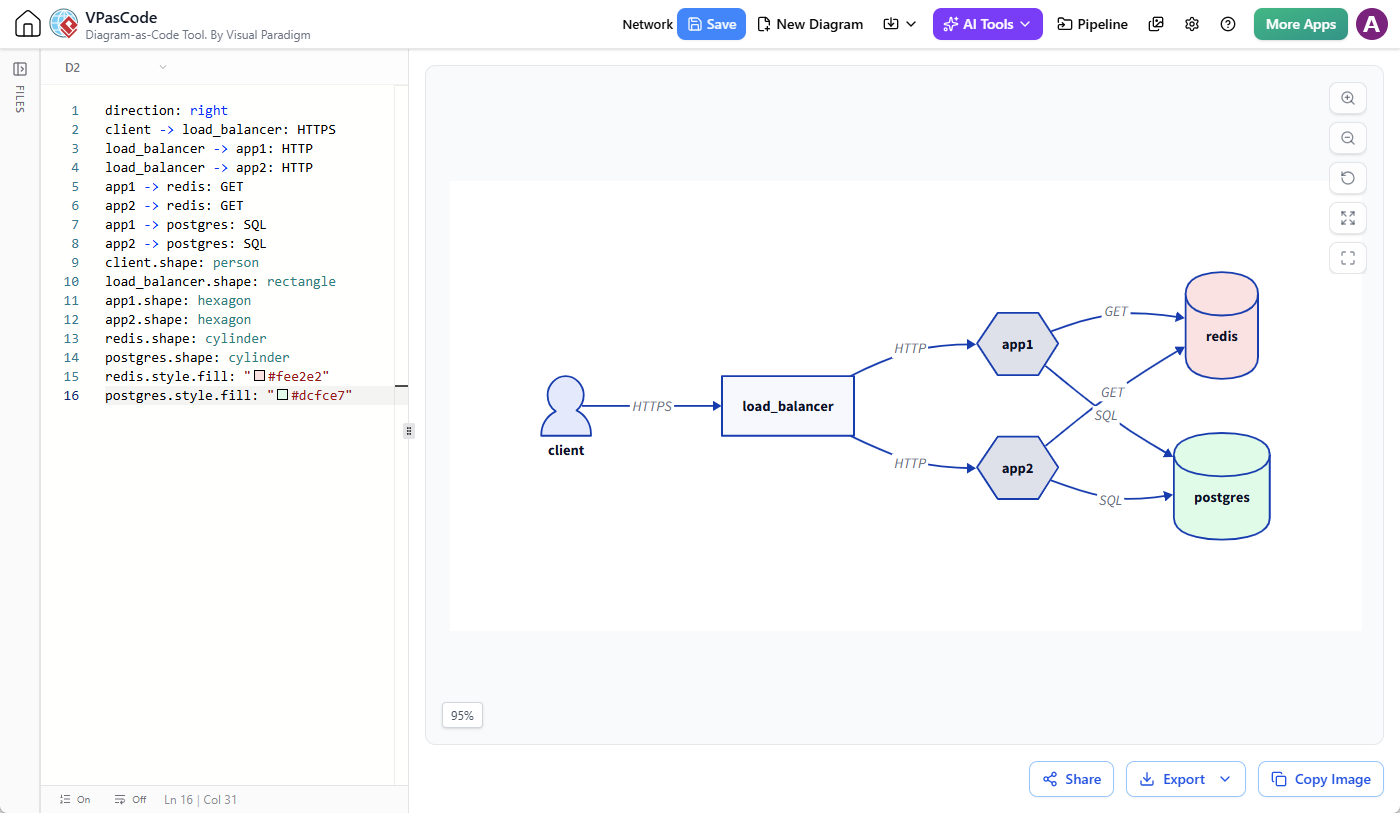
direction: right
client -> load_balancer: HTTPS
load_balancer -> app1: HTTP
load_balancer -> app2: HTTP
app1 -> redis: GET
app2 -> redis: GET
app1 -> postgres: SQL
app2 -> postgres: SQL
client.shape: person
load_balancer.shape: rectangle
app1.shape: hexagon
app2.shape: hexagon
redis.shape: cylinder
postgres.shape: cylinder
redis.style.fill: "#fee2e2"
postgres.style.fill: "#dcfce7"
Example 5: Project Mind Map (Markmap)
For brainstorming and planning, Markmap turns Markdown into interactive mind maps.
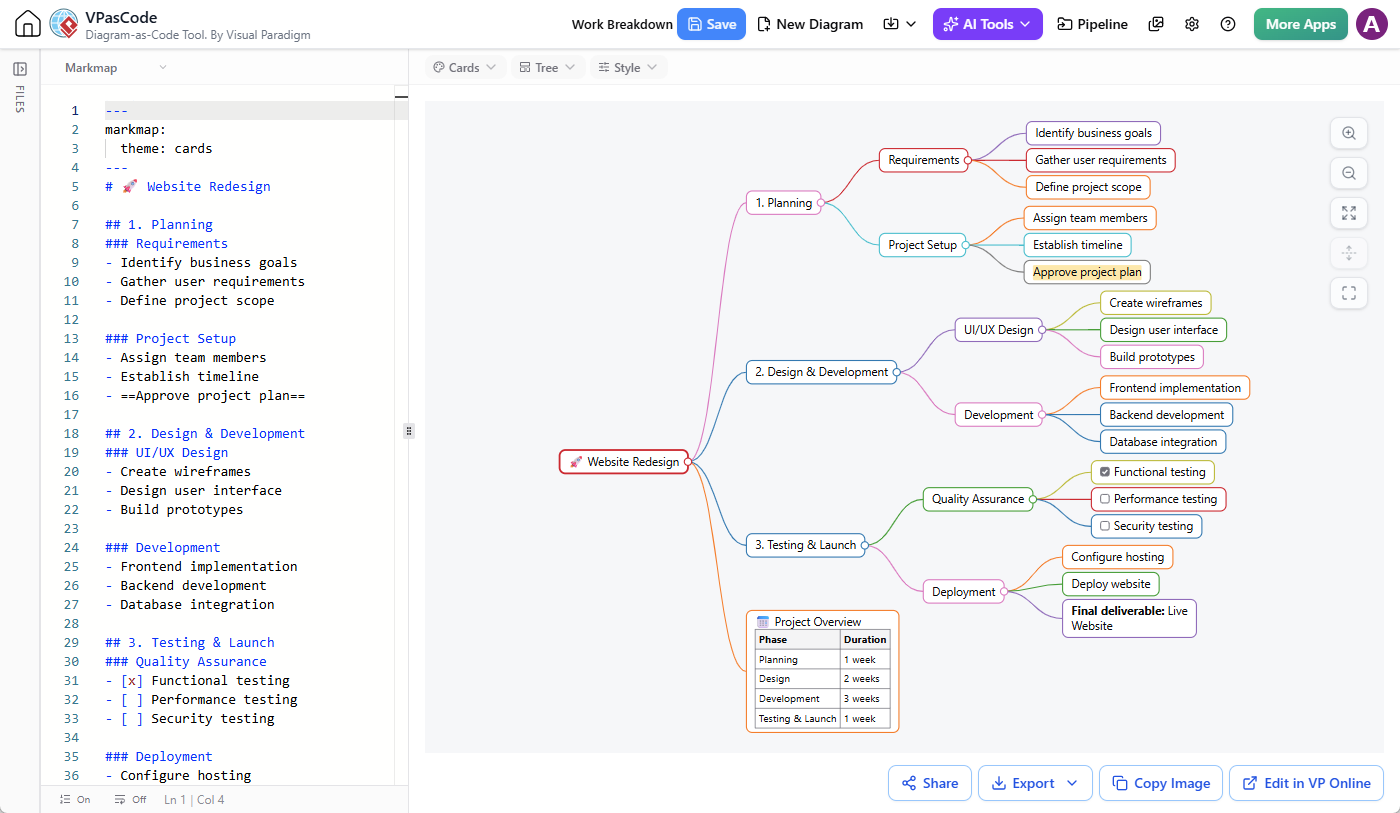
---
markmap:
  theme: cards
---
#  Website Redesign

## 1. Planning
### Requirements
- Identify business goals
- Gather user requirements
- Define project scope

### Project Setup
- Assign team members
- Establish timeline
- ==Approve project plan==

## 2. Design & Development
### UI/UX Design
- Create wireframes
- Design user interface
- Build prototypes

### Development
- Frontend implementation
- Backend development
- Database integration

## 3. Testing & Launch
### Quality Assurance
- [x] Functional testing
- [ ] Performance testing
- [ ] Security testing

### Deployment
- Configure hosting
- Deploy website
- **Final deliverable:** Live Website

##  Project Overview
| Phase | Duration |
|---|---:|
| Planning | 1 week |
| Design | 2 weeks |
| Development | 3 weeks |
| Testing & Launch | 1 week |
Example 6: Sales Data Visualization (ECharts)
For data-heavy reports, ECharts allows for rich, interactive charts.
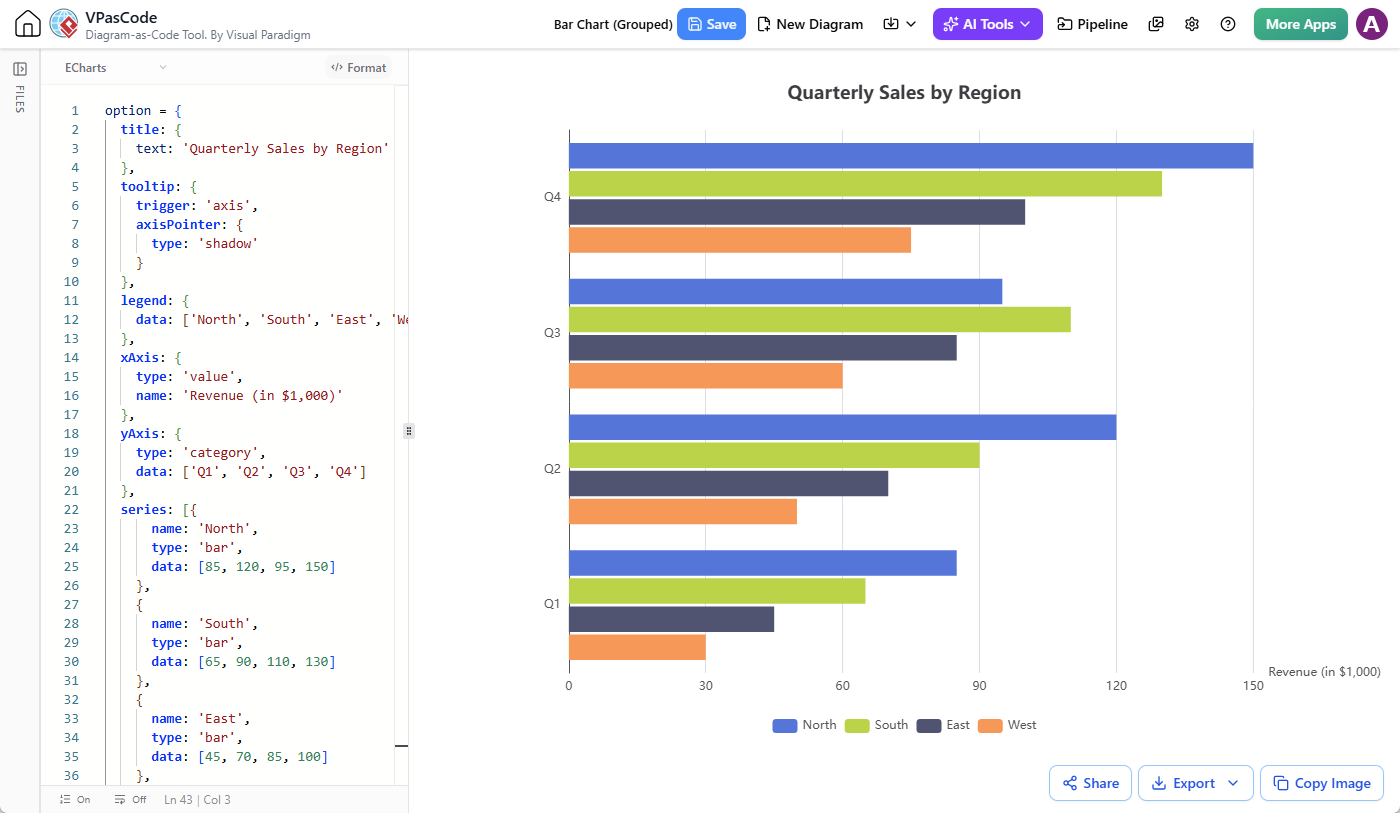
option = {
  title: {
    text: 'Quarterly Sales by Region'
  },
  tooltip: {
    trigger: 'axis',
    axisPointer: {
      type: 'shadow'
    }
  },
  legend: {
    data: ['North', 'South', 'East', 'West']
  },
  xAxis: {
    type: 'value',
    name: 'Revenue (in $1,000)'
  },
  yAxis: {
    type: 'category',
    data: ['Q1', 'Q2', 'Q3', 'Q4']
  },
  series: [{
      name: 'North',
      type: 'bar',
      data: [85, 120, 95, 150]
    },
    {
      name: 'South',
      type: 'bar',
      data: [65, 90, 110, 130]
    },
    {
      name: 'East',
      type: 'bar',
      data: [45, 70, 85, 100]
    },
    {
      name: 'West',
      type: 'bar',
      data: [30, 50, 60, 75]
    }
  ]
};
AI-Powered Workflow Integration
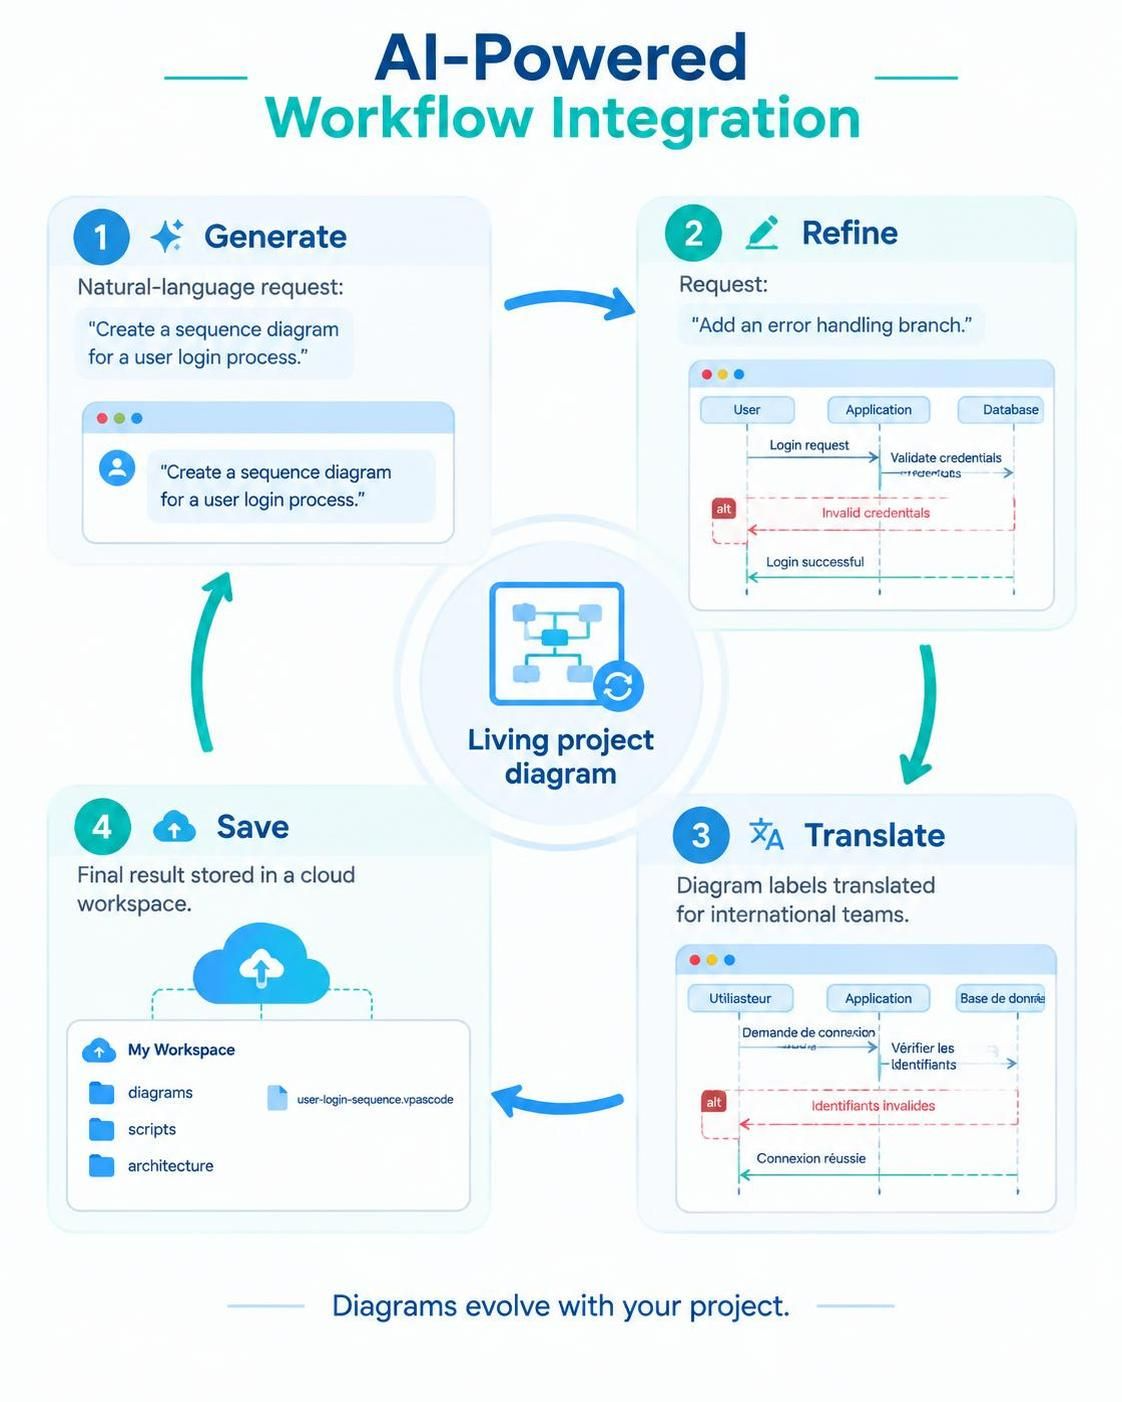
The true power of VPasCode lies in the combination of cloud storage and AI assistance.
-
Generate: Describe your diagram in natural language (e.g., “Create a sequence diagram for a user login process”).
-
Refine: Ask AI to modify the generated code (e.g., “Add an error handling branch”).
-
Translate: Use AI to translate labels for international teams.
-
Save: Store the final result in your cloud workspace for future reference.
This cycle ensures that diagrams are not just one-off creations but living documents that evolve with your project.
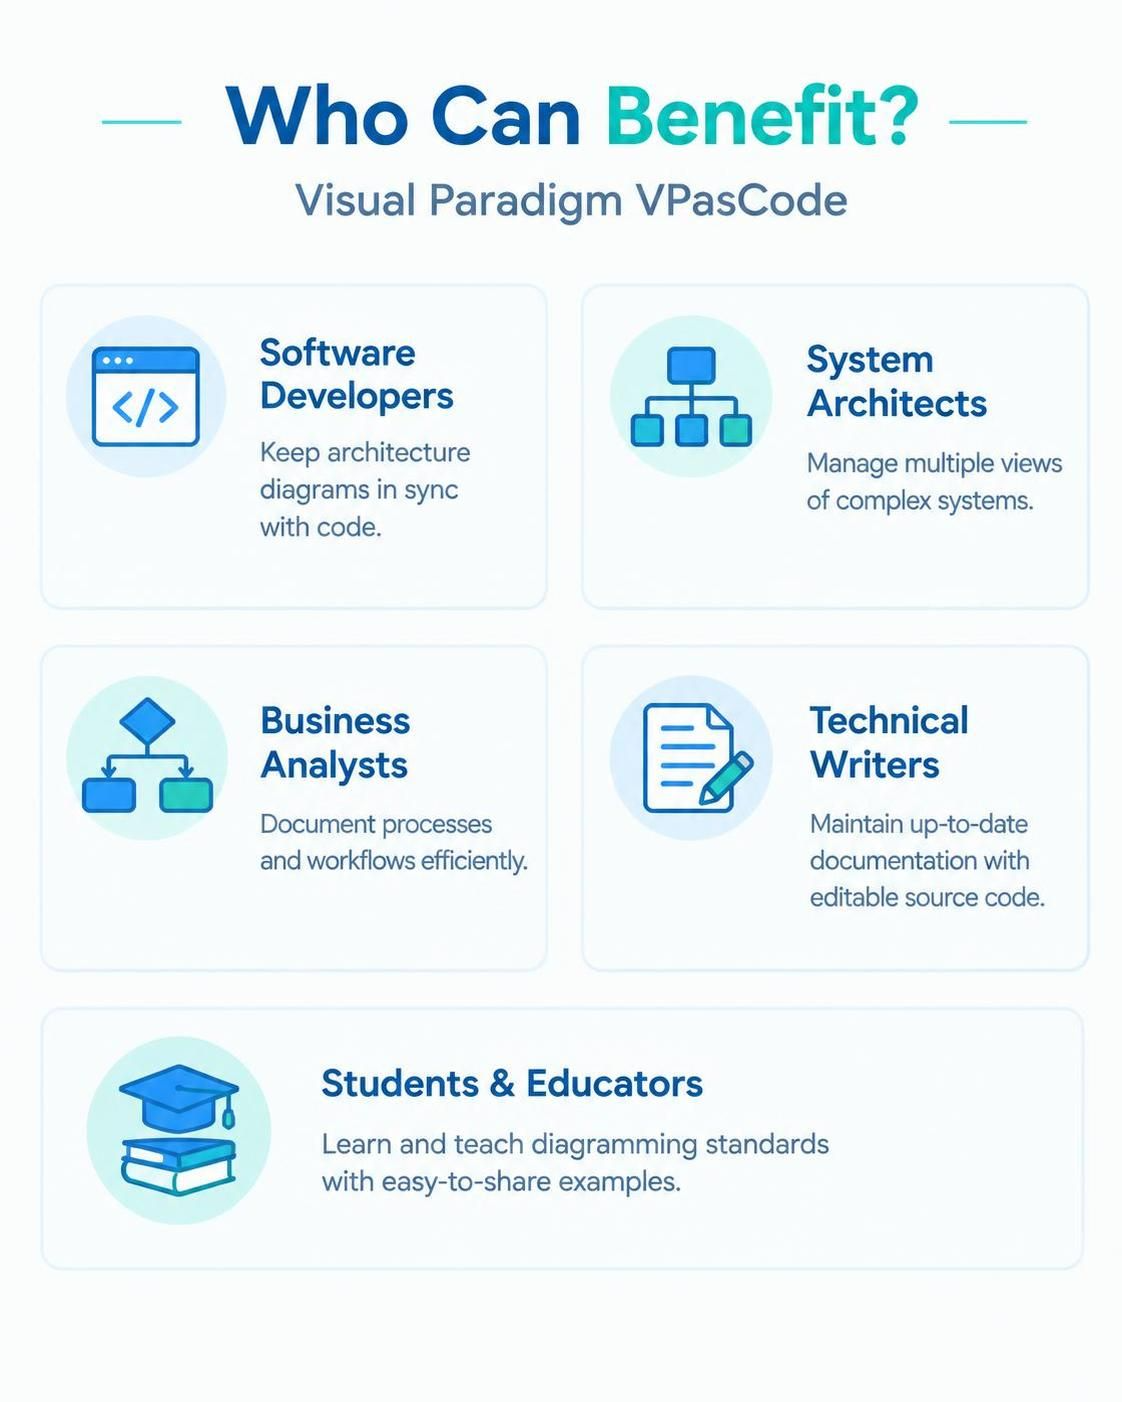
Who Can Benefit?
-
Software Developers: Keep architecture diagrams in sync with code.
-
System Architects: Manage multiple views of complex systems.
-
Business Analysts: Document processes and workflows efficiently.
-
Technical Writers: Maintain up-to-date documentation with editable source code.
-
Students & Educators: Learn and teach diagramming standards with easy-to-share examples.
Availability
Cloud file saving is a premium feature available to users with:
-
Visual Paradigm Online Combo Edition or higher.
-
Visual Paradigm Desktop Professional Edition or higher.
Conclusion
The introduction of cloud file saving in Visual Paradigm VPasCode marks a significant step forward for diagram-as-code enthusiasts. By providing a persistent, organized, and multi-format workspace, VPasCode eliminates the friction associated with managing diagram scripts. Whether you are using PlantUML for UML modeling, Mermaid for flowcharts, or D2 for architecture, you can now save, share, and iterate on your work with ease. Combined with AI-powered generation and refinement, VPasCode offers a comprehensive solution for modern technical documentation.
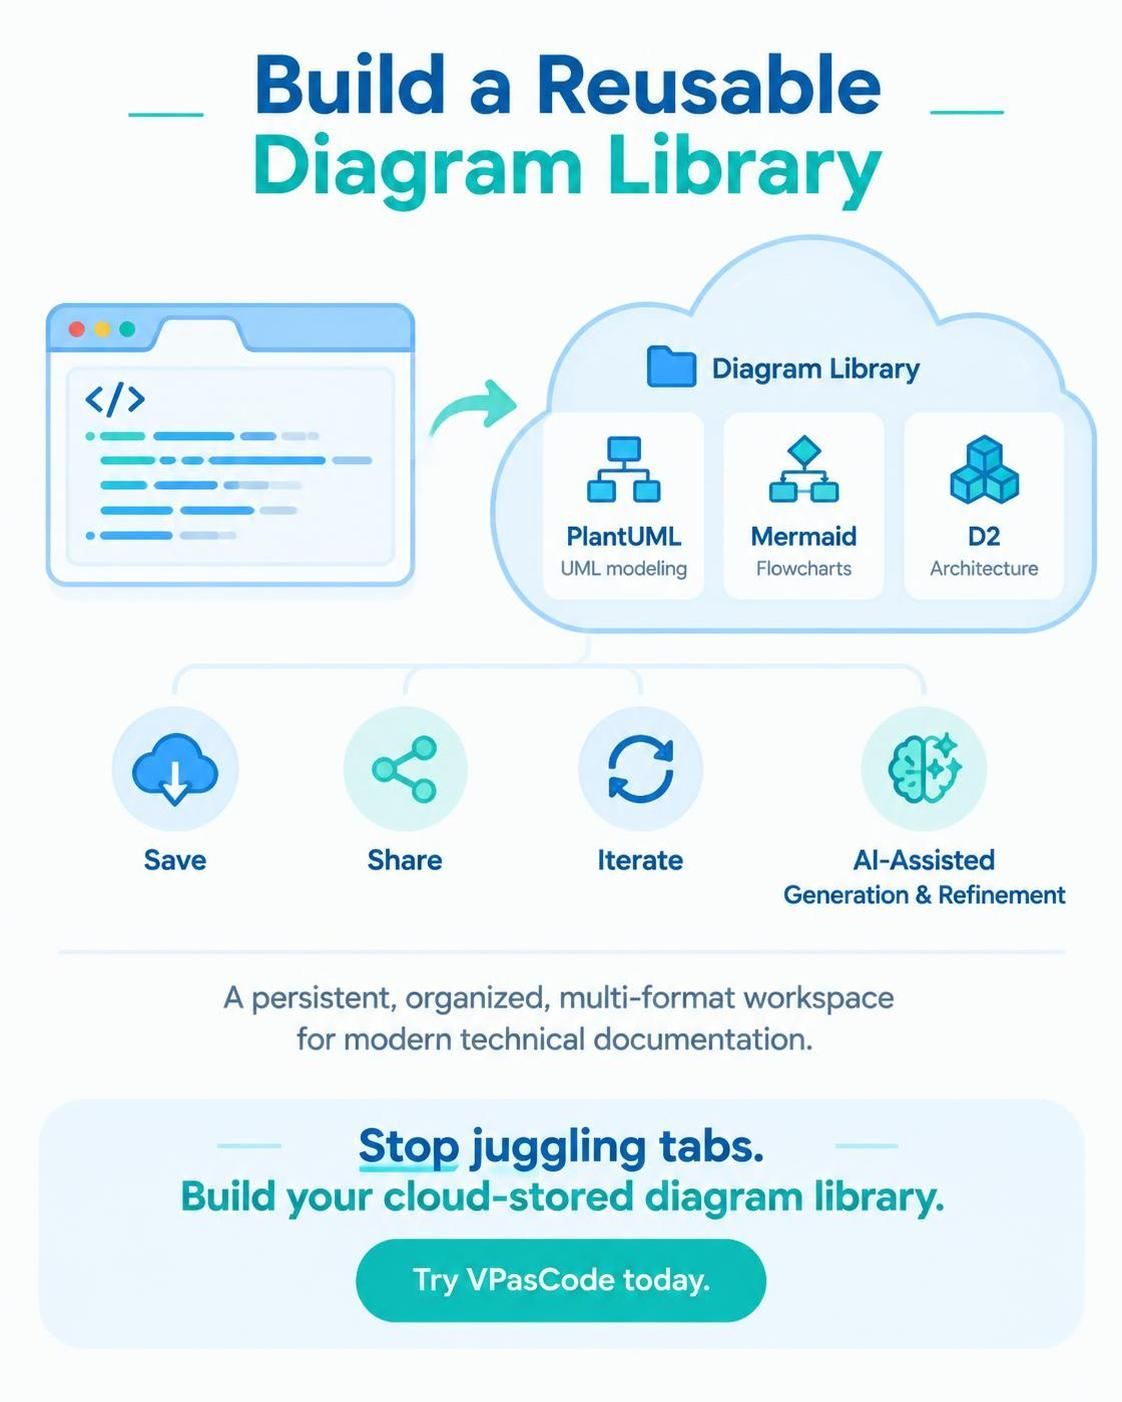
Stop juggling browser tabs and start building a library of reusable, cloud-stored diagrams. Try VPasCode today and experience the future of diagramming.
Recommended Reading: Visual Paradigm Resources
-
Visual Paradigm VPasCode Feature Page: Overview of VPasCode capabilities, supported formats, and AI tools.
-
AI Diagram Generation and Code Modification: Guide to using AI for creating and refining diagrams in VPasCode.
-
AI Diagram Translation: How to use AI to translate diagram labels for global teams.
-
Visual Paradigm Updates Blog: Latest news, features, and tutorials for Visual Paradigm products.